Chapter 6 Functional architecture
6.1 Enterprise component model
The Enterprise Digital Twin (EDT) builds its enterprise component model on a microservice architecture, which lets users assemble a system from the components they need.
Each component sits at the intersection of an enterprise functional area (a business domain) and a specific management task. This gives users the flexibility to configure the system so they can:
- choose and pay only for the modules that match their needs;
- see only the functions on the interface that matter for their tasks;
- grow the system’s functionality step by step.
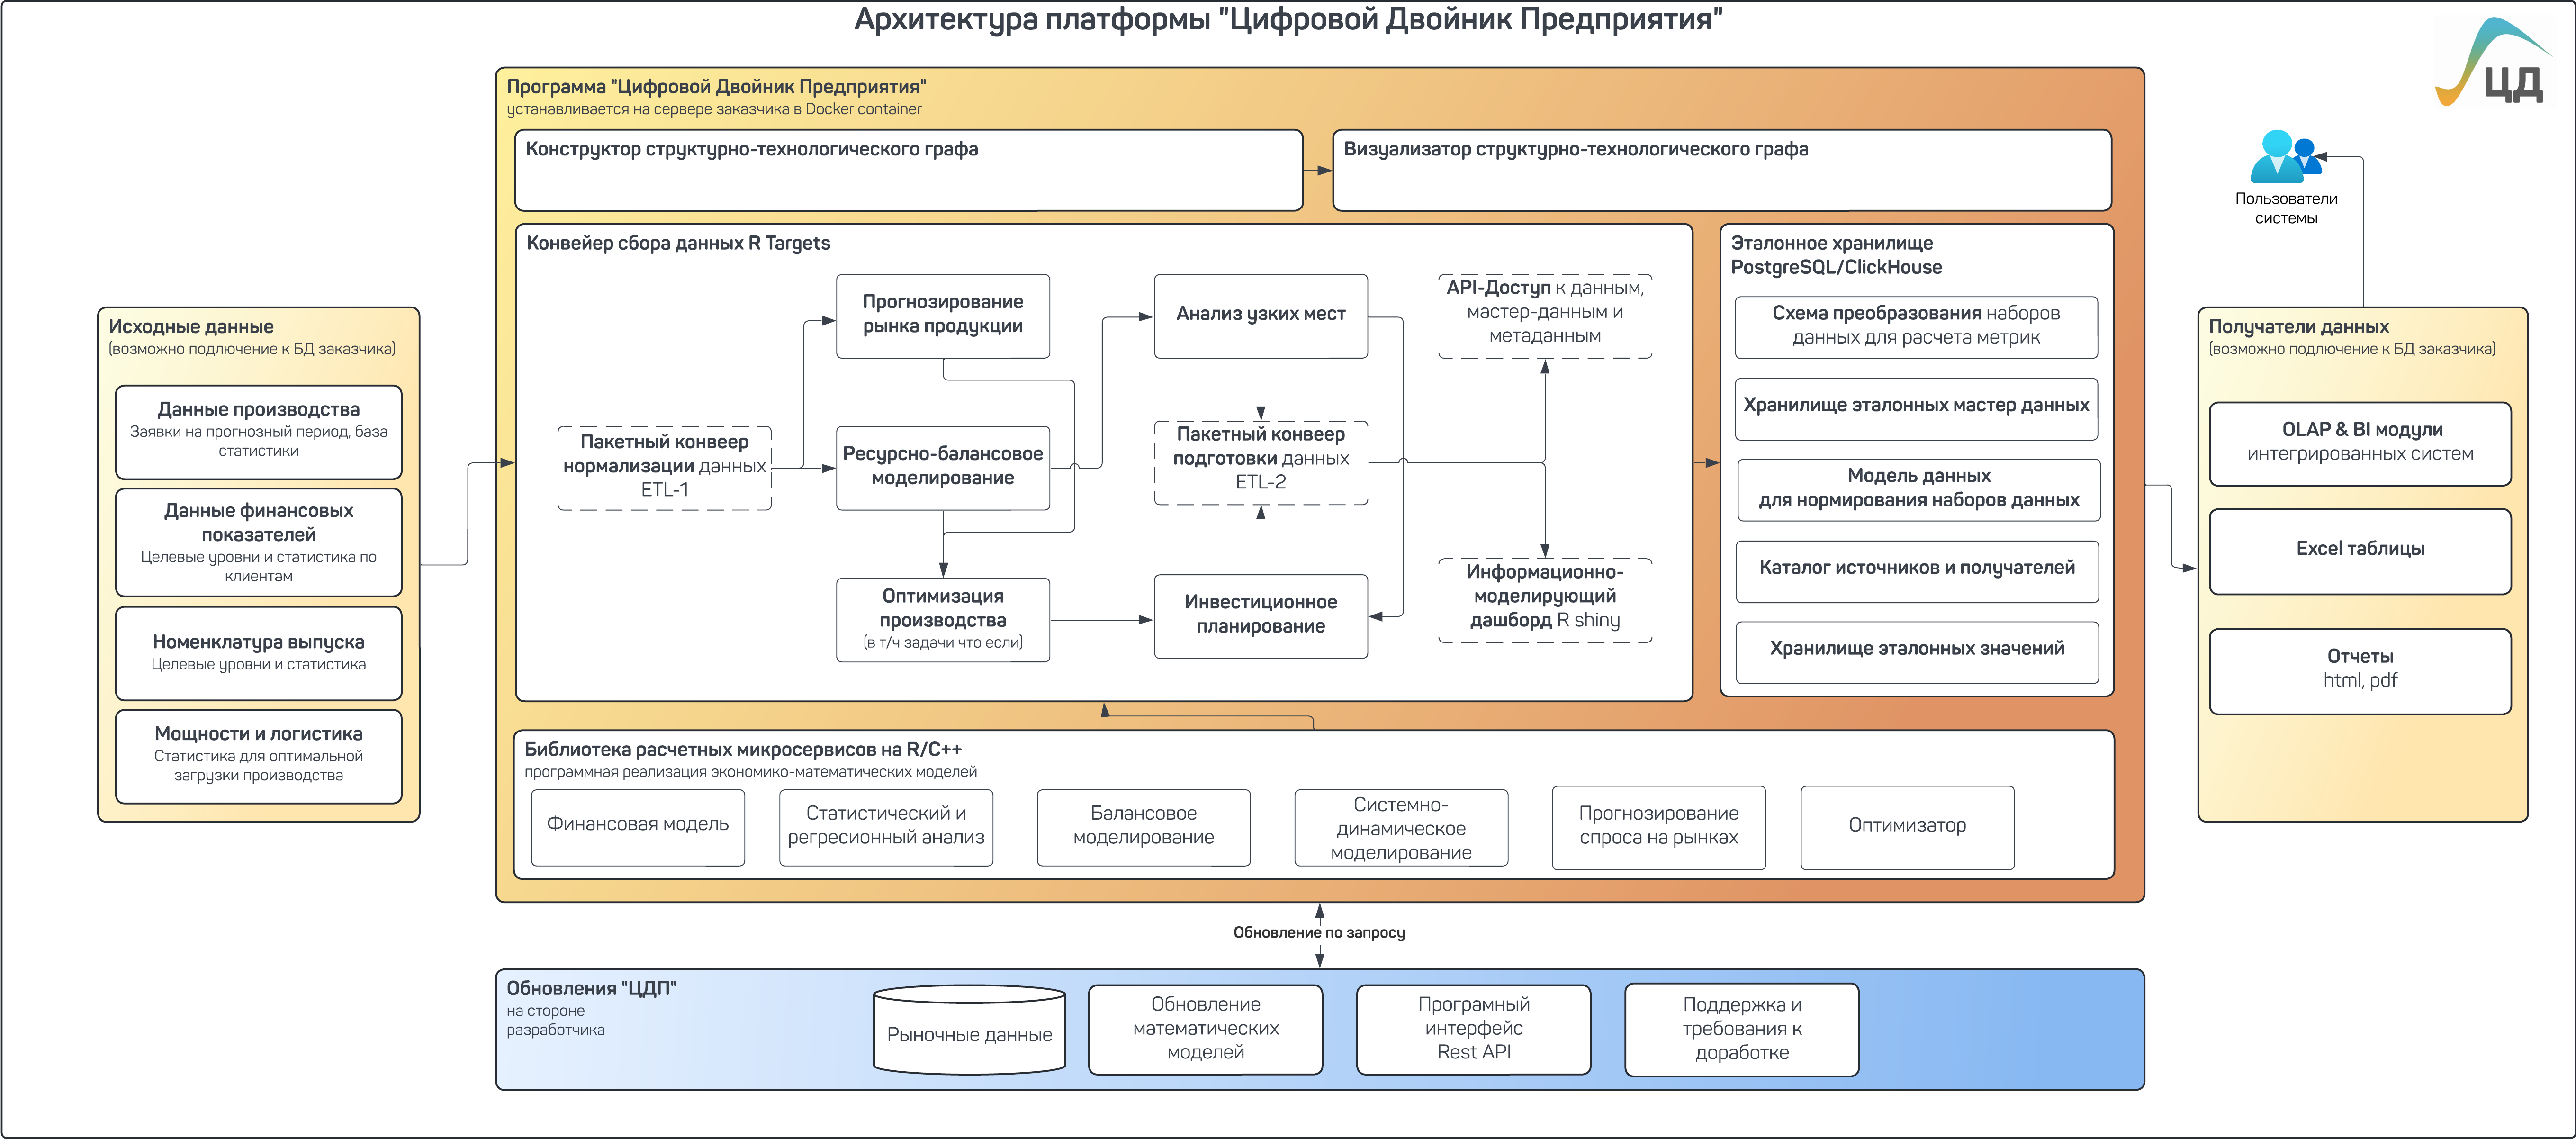
Figure 28 — IT component architecture of the EDT platform
6.2 Functional areas (business domains)
The EDT software covers the following enterprise functional areas:
1. Sales and supply — managing commercial activity
2. Production / enterprise — managing production processes
3. Economics and finance — financial planning and accounting
4. Investments — developing and maintaining the means of production
5. Logistics — managing material and product flows
6.3 Module A: Data management
Purpose: High-performance technologies for processing, storing, and analyzing large volumes of data in real time.
Core module functions:
- migrate the schemas of planning and analytical calculations from regulatory documents and existing spreadsheet tools;
- collect and integrate data from ERP, MES, and external sources through API integrations;
- normalize and validate data automatically;
- store reference data in PostgreSQL and ClickHouse;
- manage the processing pipeline using the Targets library;
- version data and keep calculations current.
Technologies:
- ETL (Extract, Transform, Load) for data integration;
- API integration (REST API, OAuth 2.0);
- PostgreSQL for storing reference data;
- ClickHouse for time-series analytics;
- R Targets for managing calculation nodes.
6.4 Module B: Monitoring and control of production processes
Purpose: Track the current state of the enterprise, monitor plan execution, and detect deviations.
Core module functions:
- Track actual sales-plan execution against key indicators and recalculate the sales plan
- Map (STS + SFS) how the enterprise organizes its activity, with the ability to link and track indicators and metrics
- Monitor the integrity of the production process infrastructure
- Assess the results of financial and economic activity (FEA)
- Account for the enterprise’s financial indicators
- Clean financial data
- Account for assets and their condition
- Monitor investments in production modernization and development
- Account for equipment depreciation and maintenance
- Map where production capacities and distribution centers sit
- Maintain target inventory levels on an ongoing basis
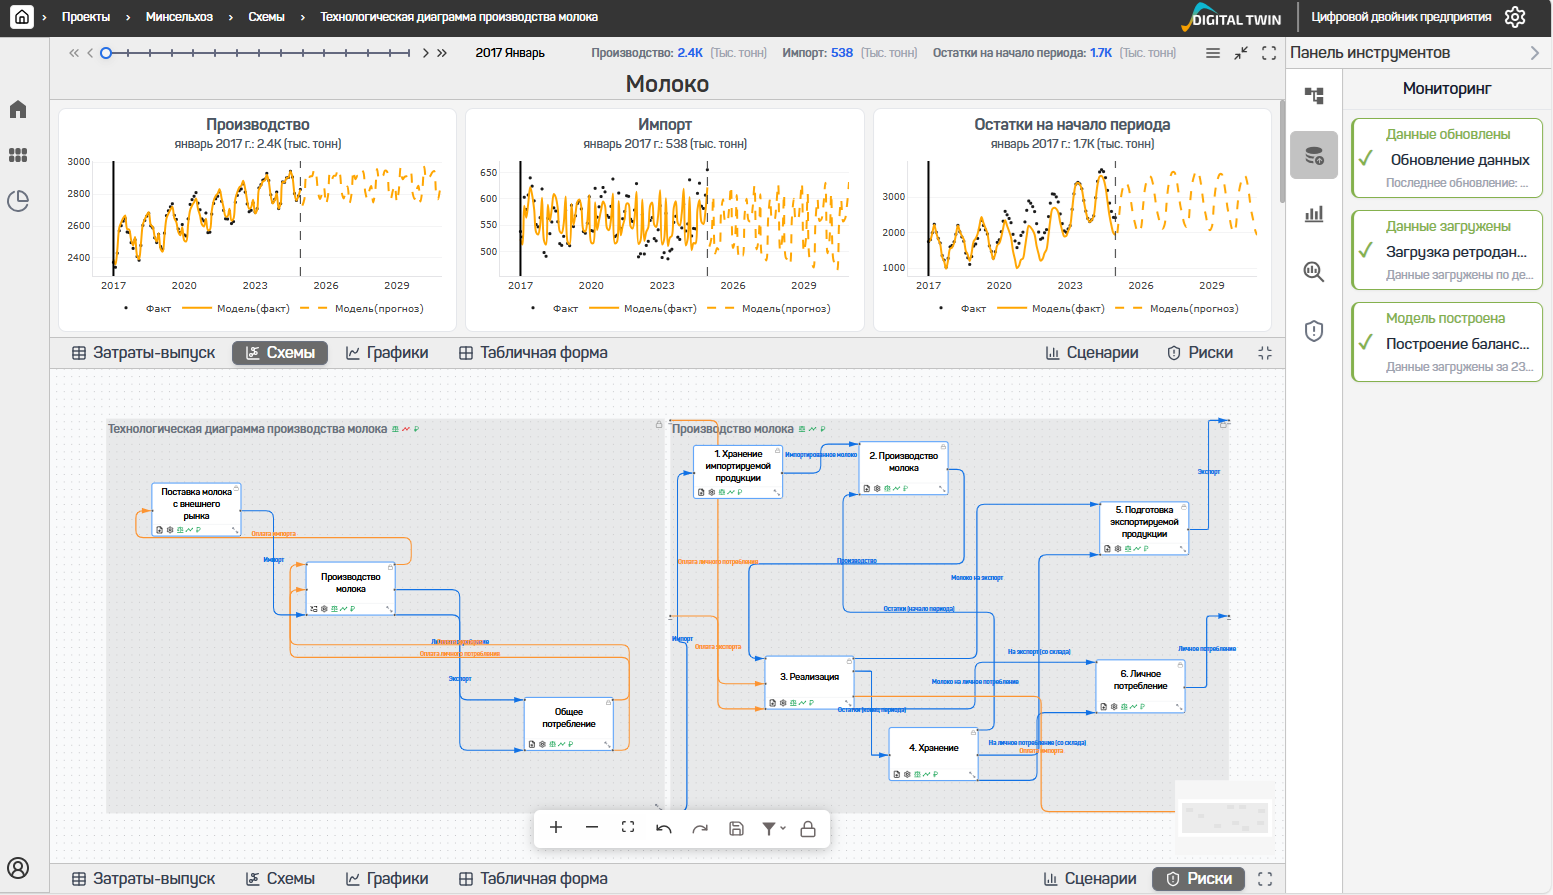
Figure 29 — Example of a production-process STS with linked plan-versus-actual indicators
6.5 Module C: Analysis and system assessment
Purpose: Analyze data in depth, surface patterns, and assess process efficiency.
Core module functions:
- Optimal sales plan
- Optimal supply plan
- Assess the efficiency of finished-product sales channels
- Build factor analysis for deviations
- Balanced tariff and pricing policy
- Assess performance, ranking sites, causes of downtime, and production risks
- Assess how production capacities align (installed, available)
- Assess technological (system) reliability and safety
- Optimal repair and reconstruction program (optimizing operating programs)
- Profitability and productivity analysis
- Ranked list of bottlenecks and efficiency-growth potential
- Risk management (forecasting receivables, budget deviations, and breaches of set parameters)
- Return-on-investment analysis
- Assess whether to modernize or replace equipment
- Storage optimization
- Find the best locations for warehouses and intermediate storage points, and analyze warehouse loading rules
- Supply-chain optimization
6.6 Module D: Forecasting and scenario modeling
Purpose: Forecast future states of the enterprise and assess the consequences of management decisions.
The analytical loop runs as one coherent system: data → unified model → forecast and scenarios → decisions → data update. The unified model combines correlational, functional, and stochastic dependencies, and it delivers a fast response, well-grounded management decisions, and transparent industry dynamics.
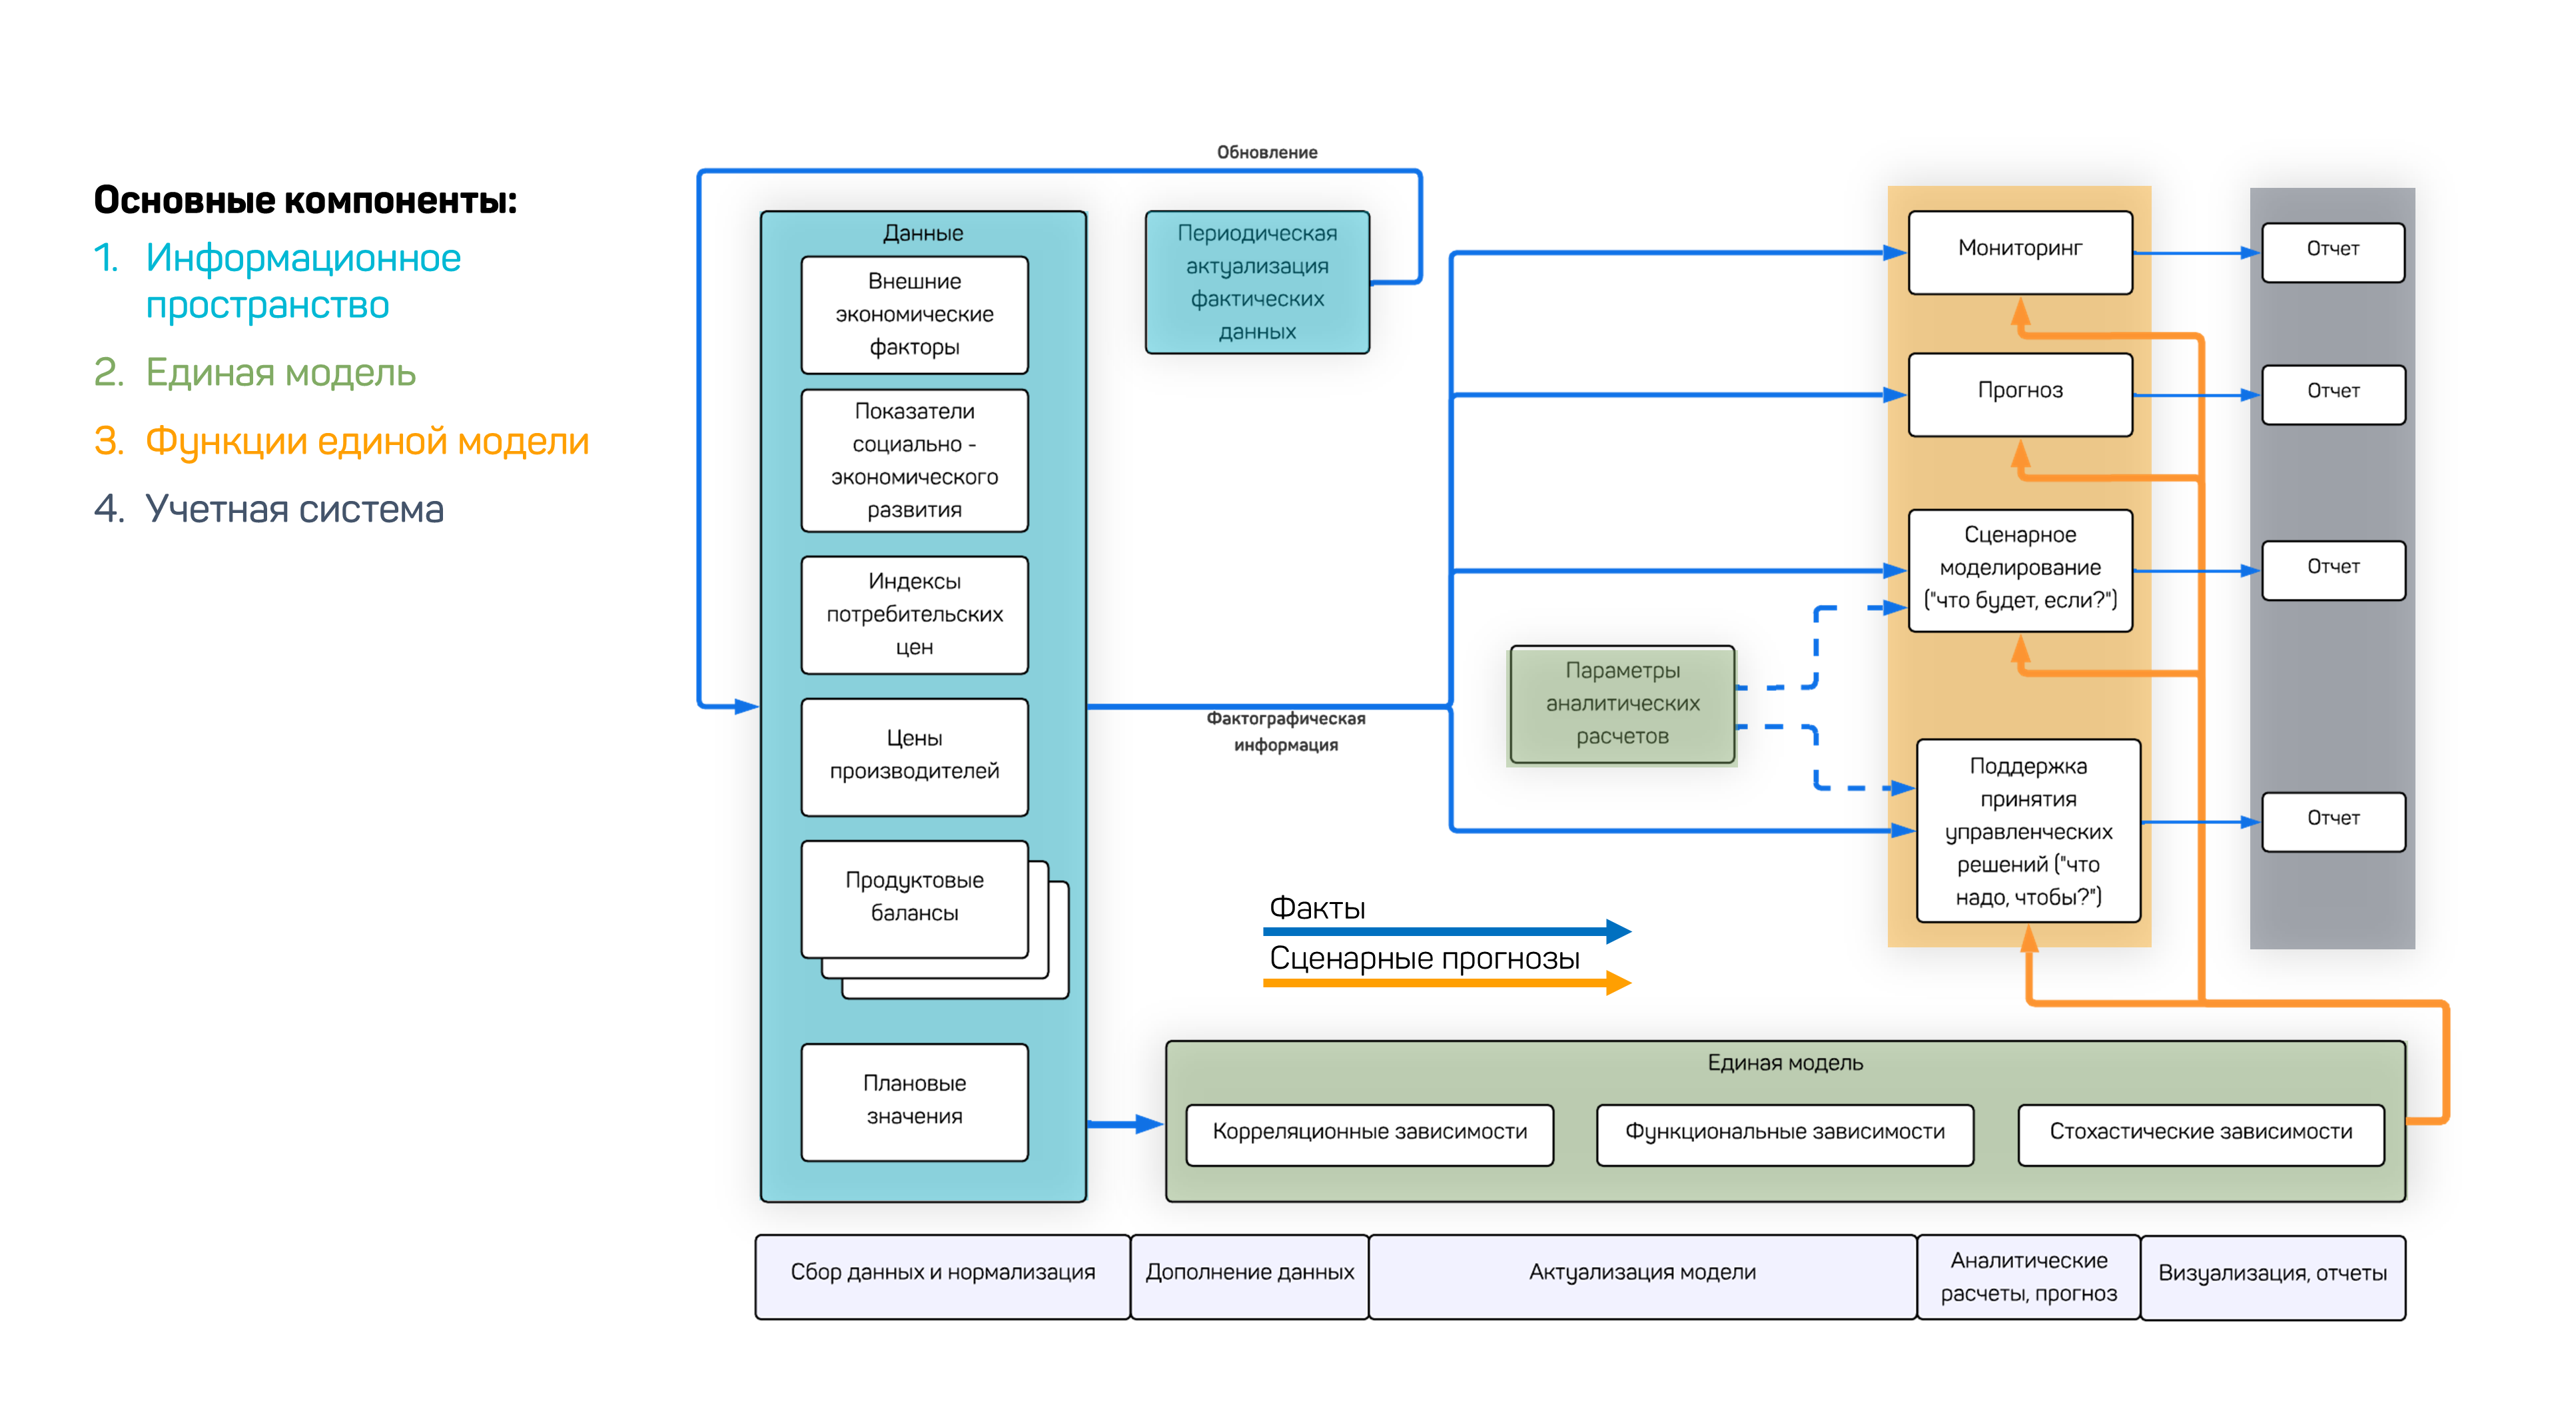
Figure 30 — Analysis and forecasting functions: the analytical loop and the unified model
Core module functions:
- Forecast supply and demand
- Forecast prices for raw materials, supplies, and finished products
- Scenario forecasting of volumes, shipment and buyout timing at various time granularities
- Scenario forecasting of production processes
- Raise output without major capital spending (by removing production constraints)
- Scenario forecasting of financial indicators (break-even points, working-capital needs, borrowing needs)
- Forecast the need for new investments to justify investment programs
- Forecast depreciation expenses and the need for capital investments
- Model production-development scenarios that account for different investment decisions
- Forecast logistics flows and transportation costs
The platform lets you set scenario conditions right in the interface: the user enters values for a key factor — production volume, for example — year by year, defining a possible development trajectory. The platform feeds that parameter into the model’s cause-and-effect structure (balance and forecast dependencies), then recalculates a consistent state for all related indicators — supply, prices, consumption, and more. The result is a new trajectory that reflects the consequences of the given scenario.
Figure 31 — Setting scenario conditions and recalculating the model in the EDT interface
6.7 Module E: Strategic optimization and investment planning
Purpose: Optimize strategic decisions and plan the enterprise’s development.
Core module functions:
- Calculate sales volumes and revenue, and the inventory required, based on the target sales level
- Telescopic, multi-product, volume-based production plan
- Optimize the production program to the enterprise’s goals
- Integrated target program (combining the plans calculated in separate modules and enterprise sections)
- Optimize the enterprise budget parameters to set goals
- Build a borrowing plan
- Set dividend policy (balancing shareholder profit against business development)
- Optimize the investment program to the enterprise’s goals
- Plan production-capacity growth and modernization
- Network planning and design: determine the optimal number, location, and capacity of warehouses, plant throughput, and line loading
- Transportation planning: strategic planning, choosing cross-docking points, consolidation points, or delivery routes, selecting transport modes and carriers, and planning and dispatching trips
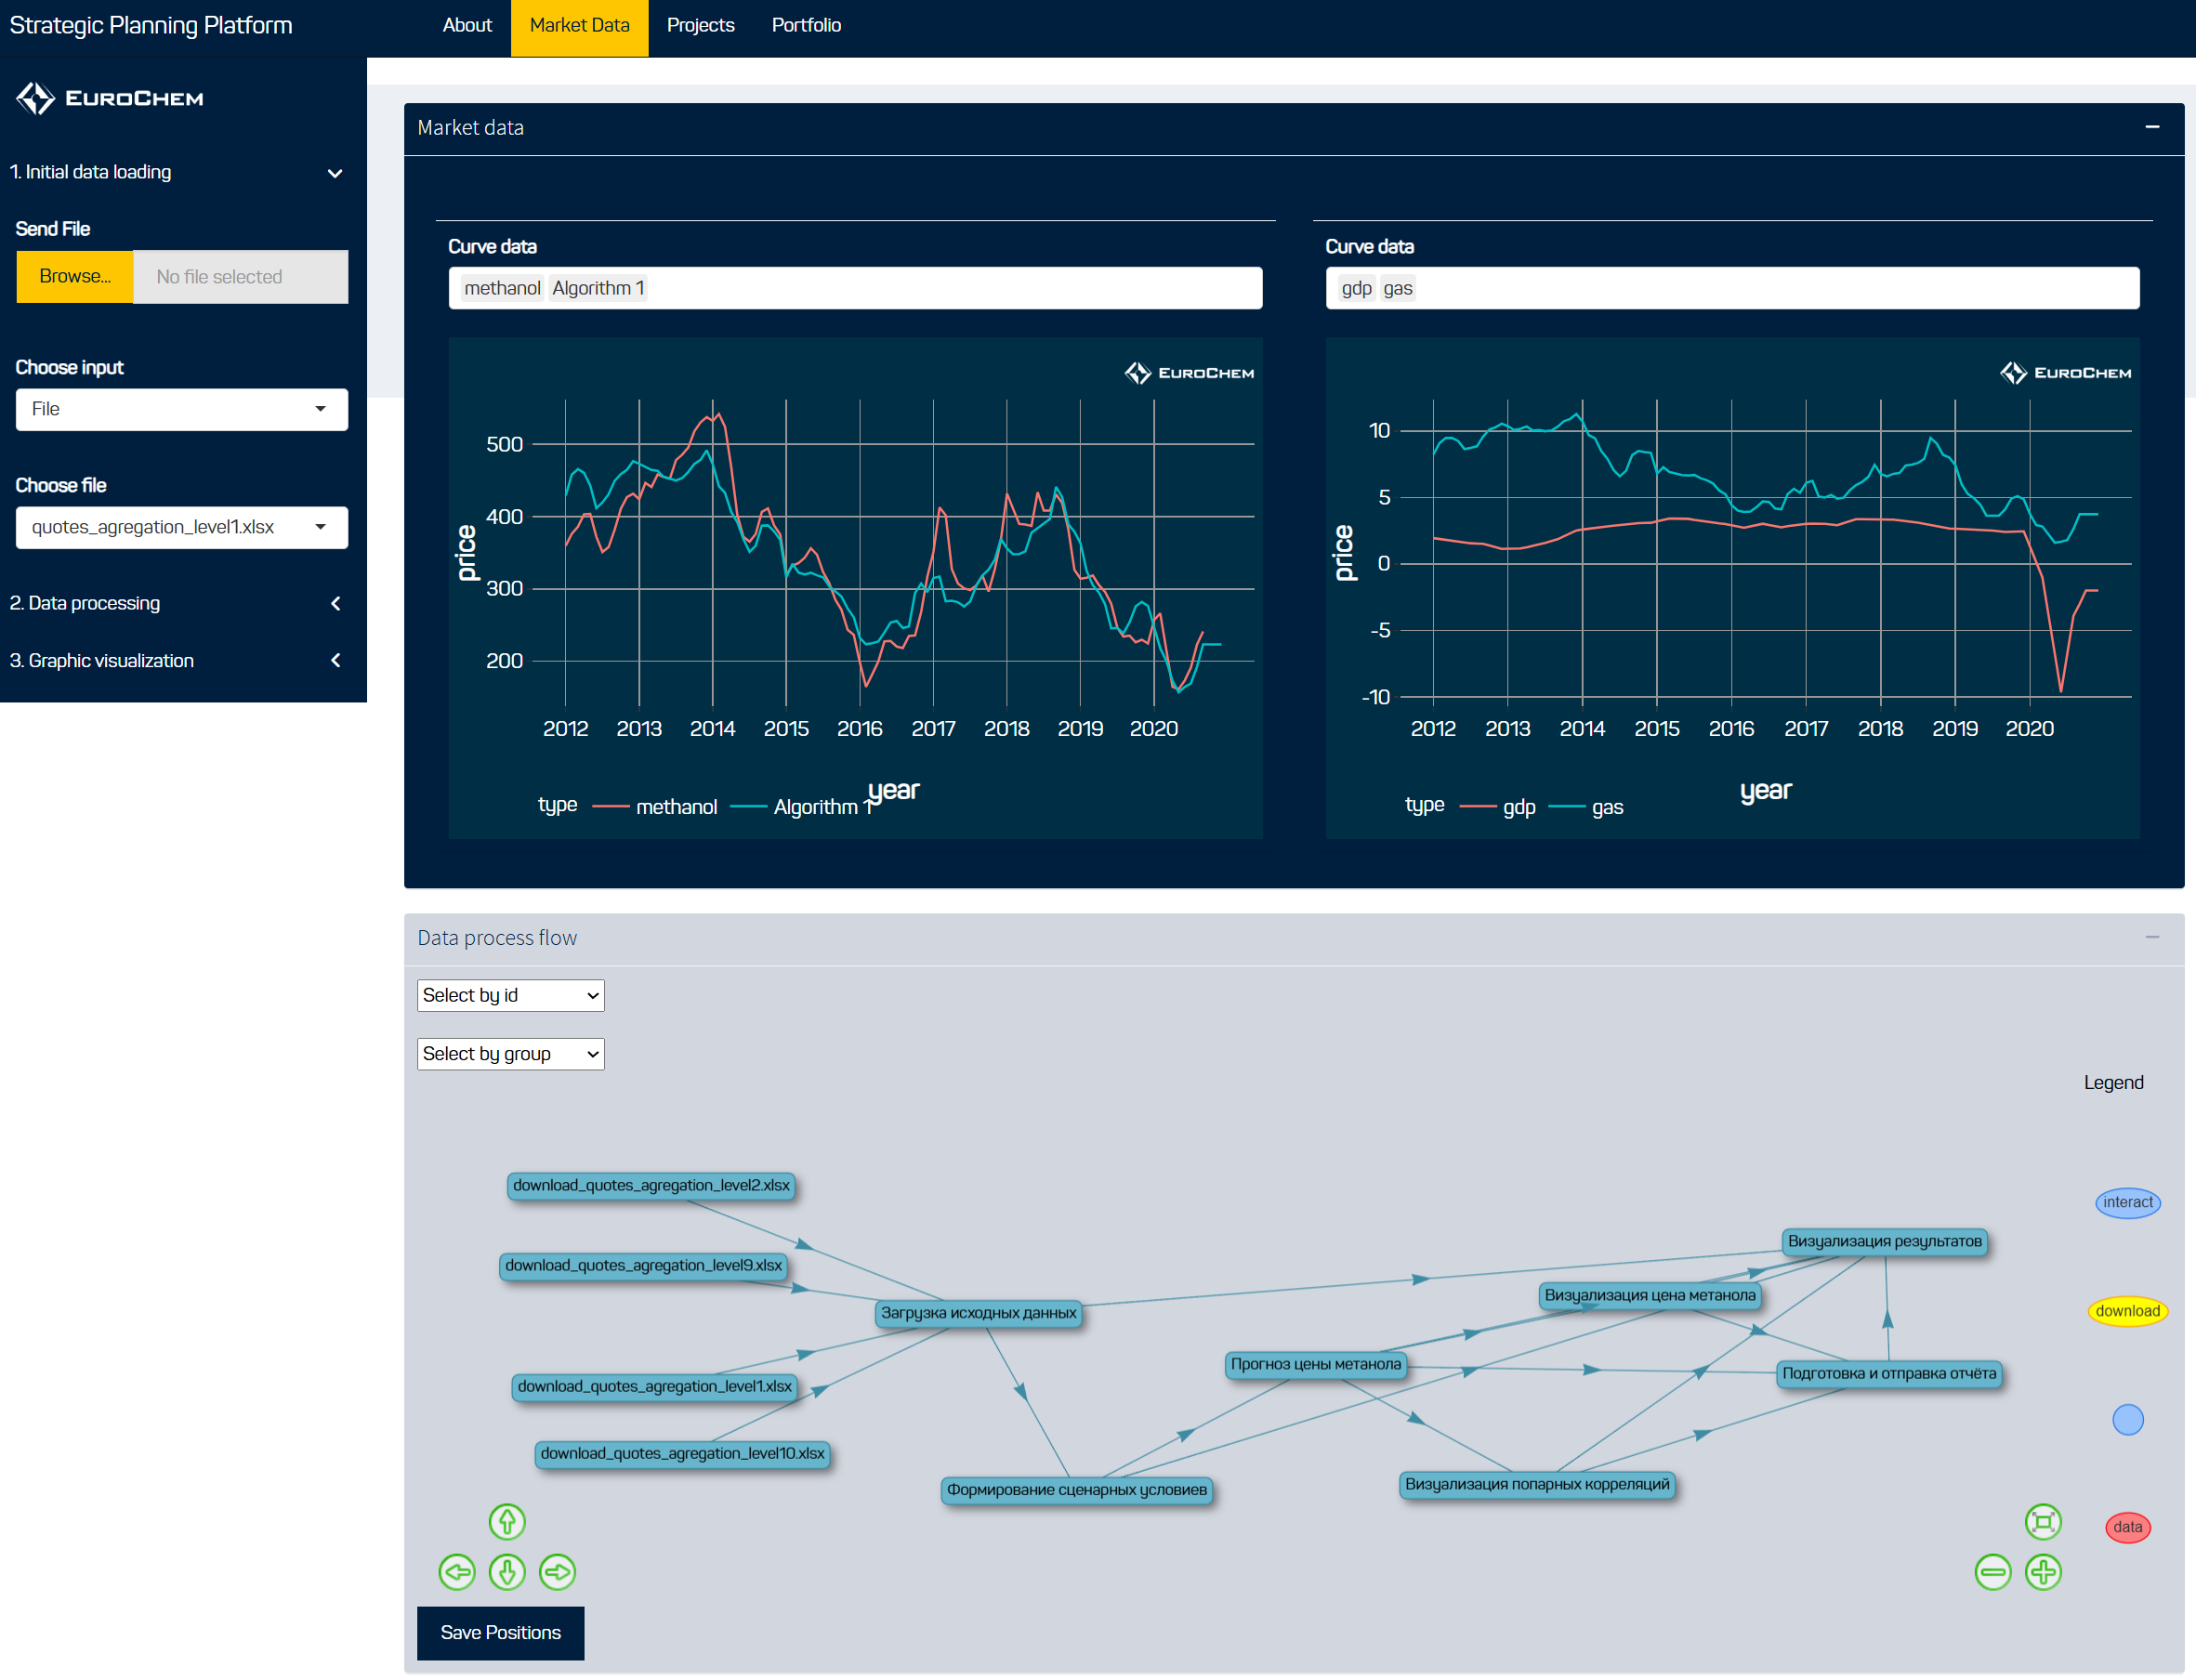
Figure 32 — The plan.dtwin.ru strategic planning platform: market-data analysis and the processing pipeline
6.8 How the modules work together
All EDT modules run as a single integrated system, where each component receives data from the ones before it and passes results to the ones after it:
1. Module A (Data management) supplies every other module with current, reliable data
2. Module B (Monitoring) tracks the current state and detects deviations
3. Module C (Analysis) runs in-depth analysis and efficiency assessment
4. Module D (Forecasting) predicts future states and models scenarios
5. Module E (Optimization) finds the optimal decisions for reaching the enterprise’s goals
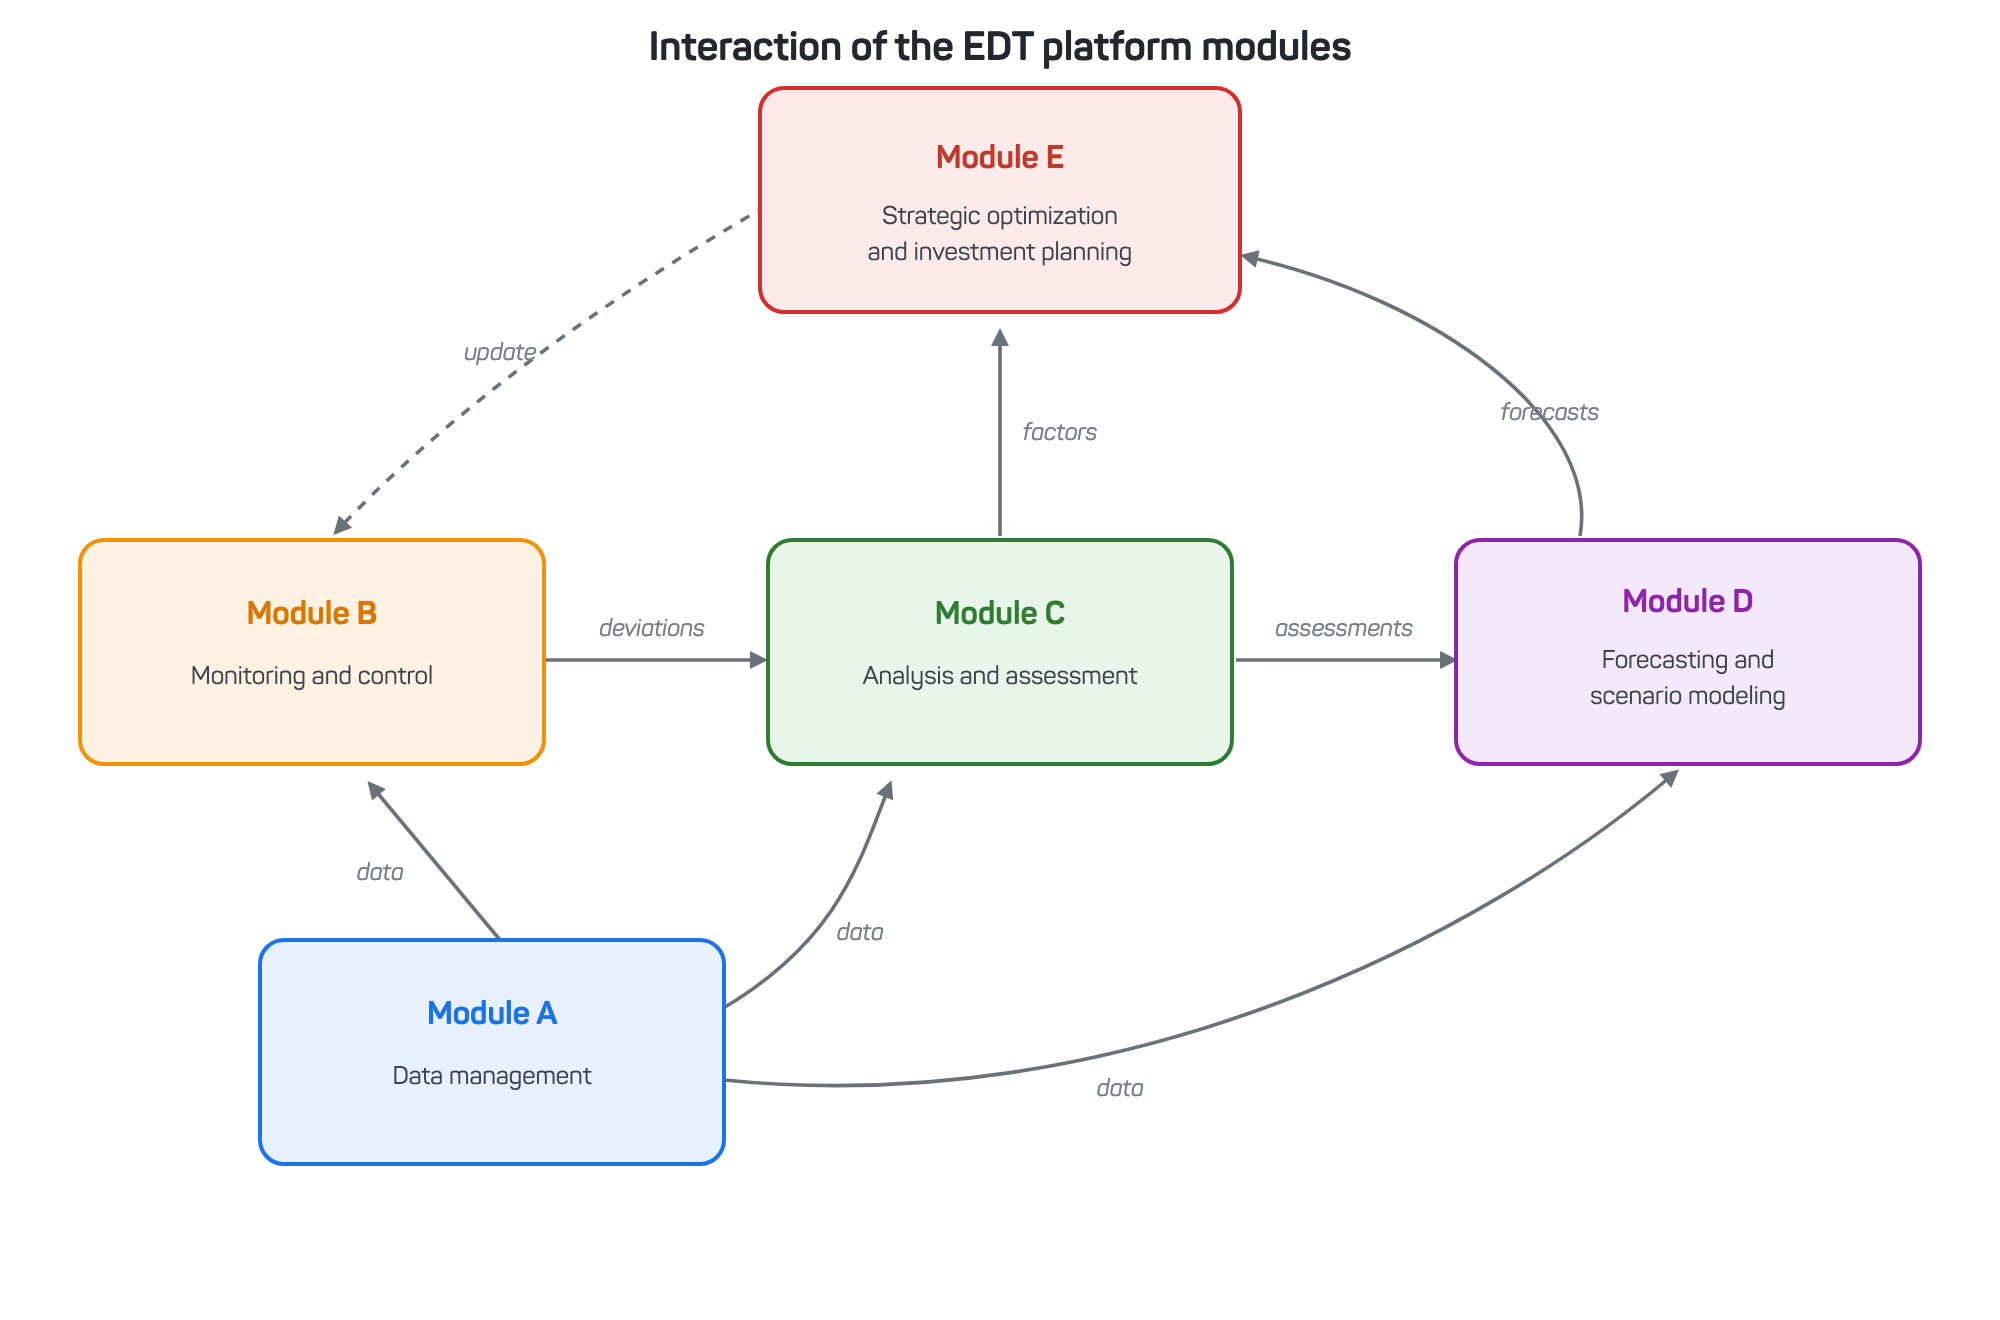
Figure 33 — How the EDT platform modules work together: flows of data, analytics, and management decisions
The microservice architecture lets you combine modules flexibly, depending on what a given enterprise needs.
6.9 Functional architecture: levels zero and one
At the zero level of the functional architecture, the system takes in goals and constraints, user scenarios, and historical data on volumes, prices, factors, and capacities. It outputs alerts on acceptable deviations, inertial and user forecasts, and optimal production plans.
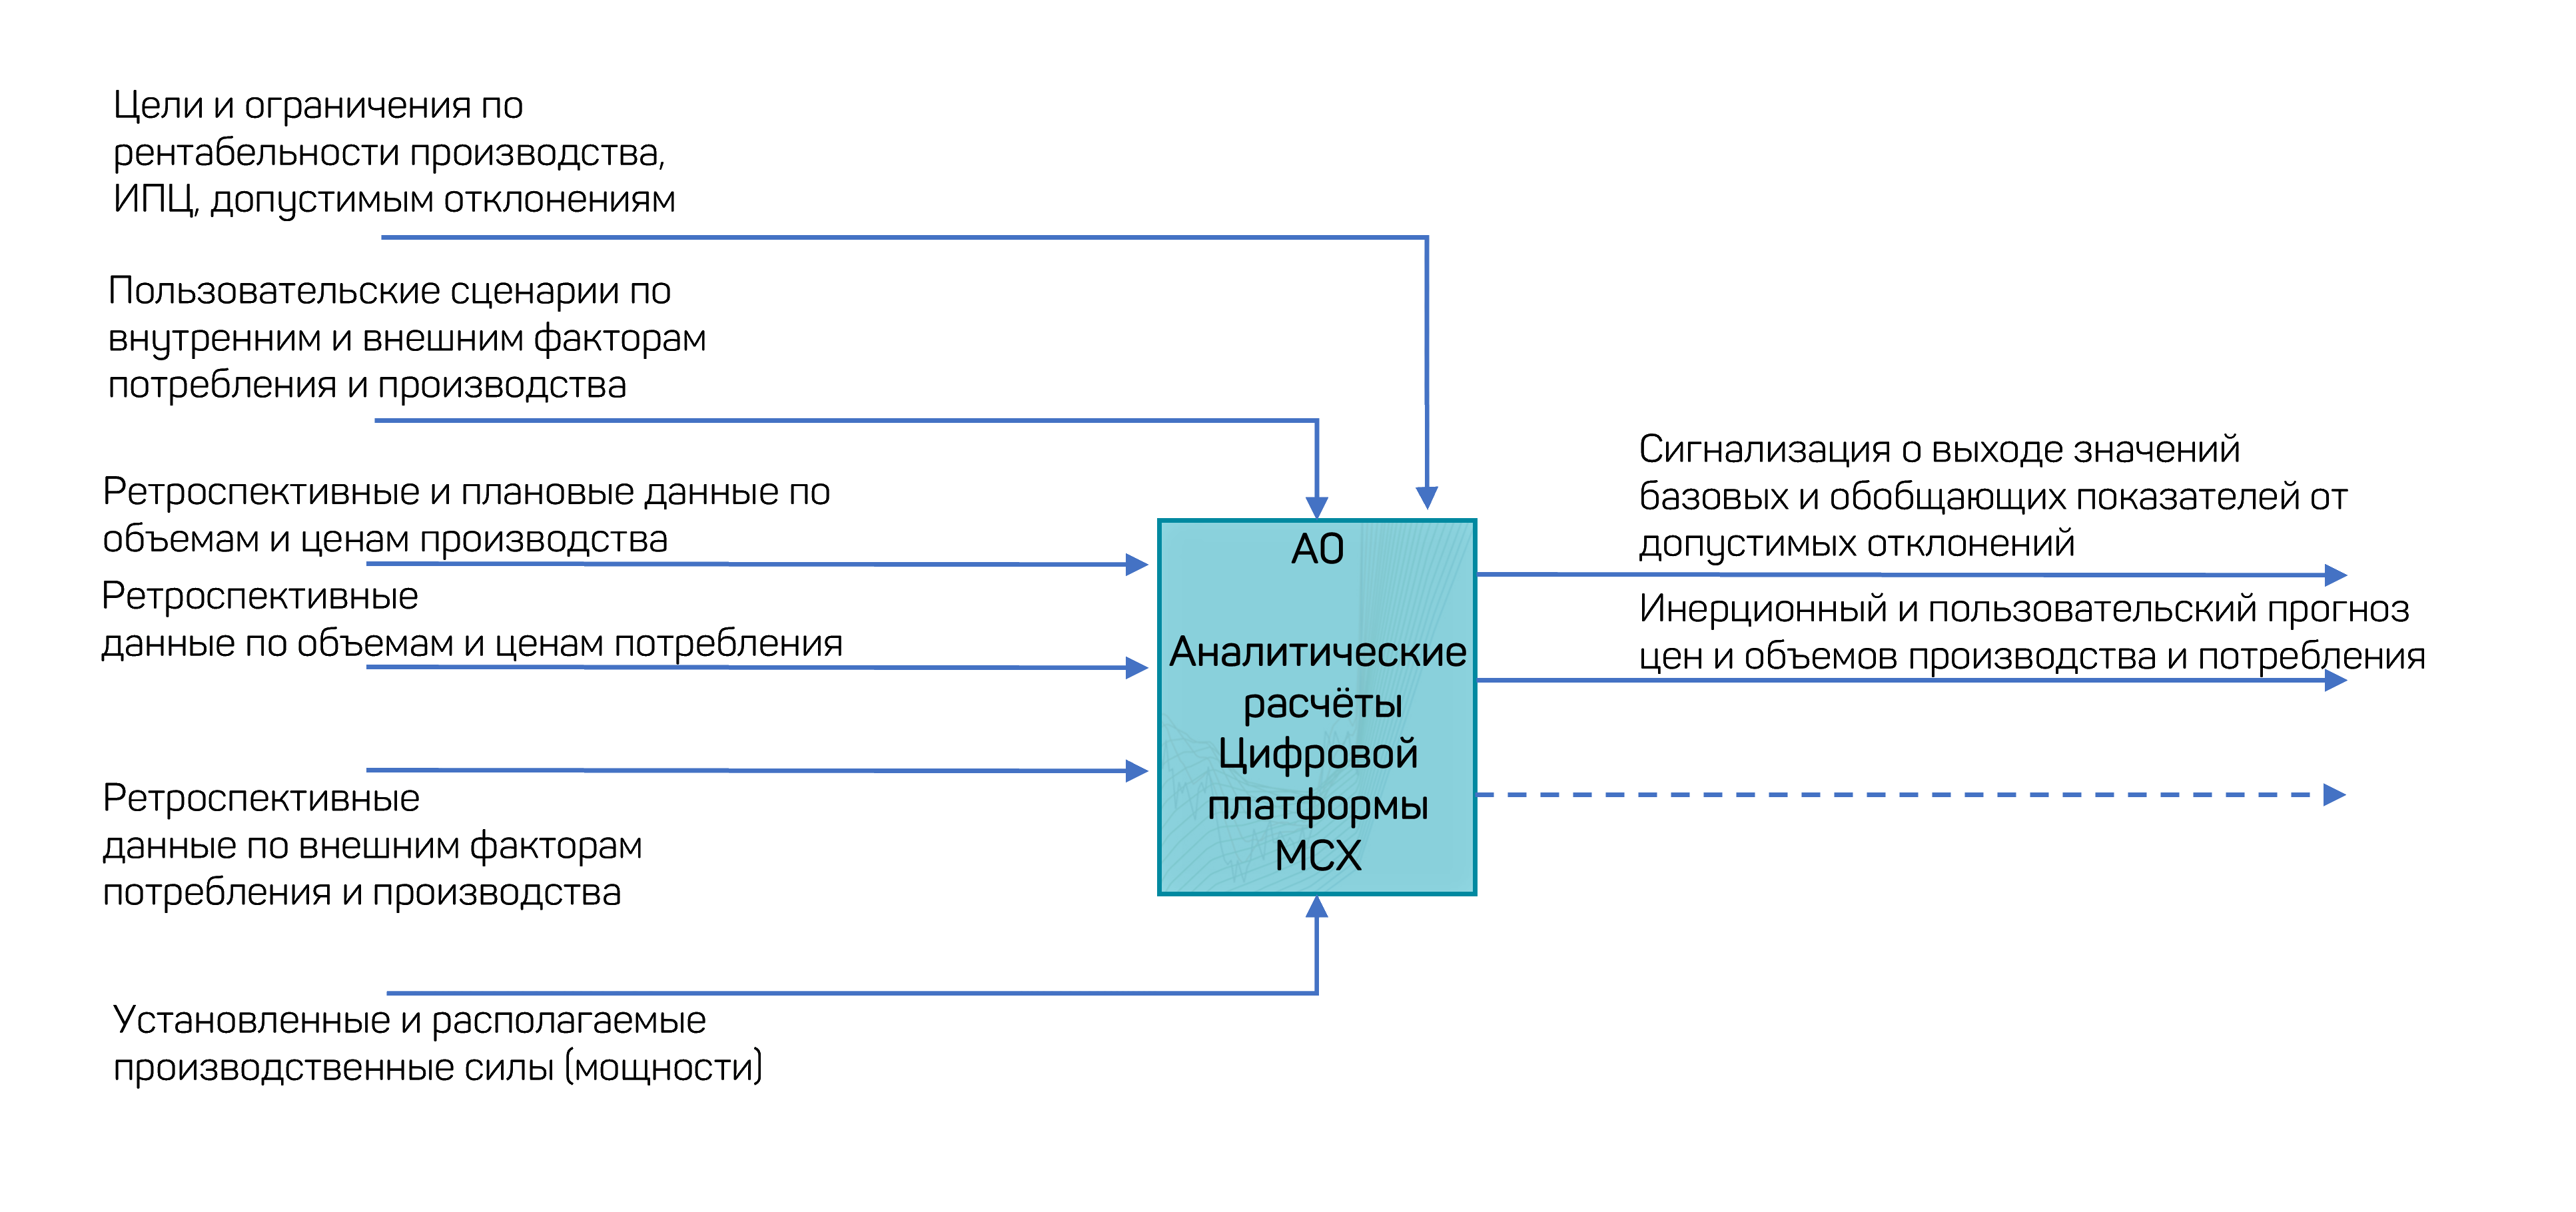
Figure 34 — Zero-level functional architecture: inputs and outputs of the Digital Platform’s analytical calculations
At the first level, the functional architecture breaks down into specific functions:
- F1 — collect and normalize historical data on indicators
- F2.1 — forecast socio-economic development, markets, and exchange rates
- F2.2 — forecast the consumer price index (CPI) and producer prices
- F3.1 — develop scenarios of external management actions
- F3.1 — calculate optimal production plans (Kantorovich method)
- F3.2 — balance modeling and forecasting (single-product, Leontief, dynamic)
- F4 — calculate summary indicators, visualization, and clustering
- F5 — alert when actual and forecast values cross the set boundaries
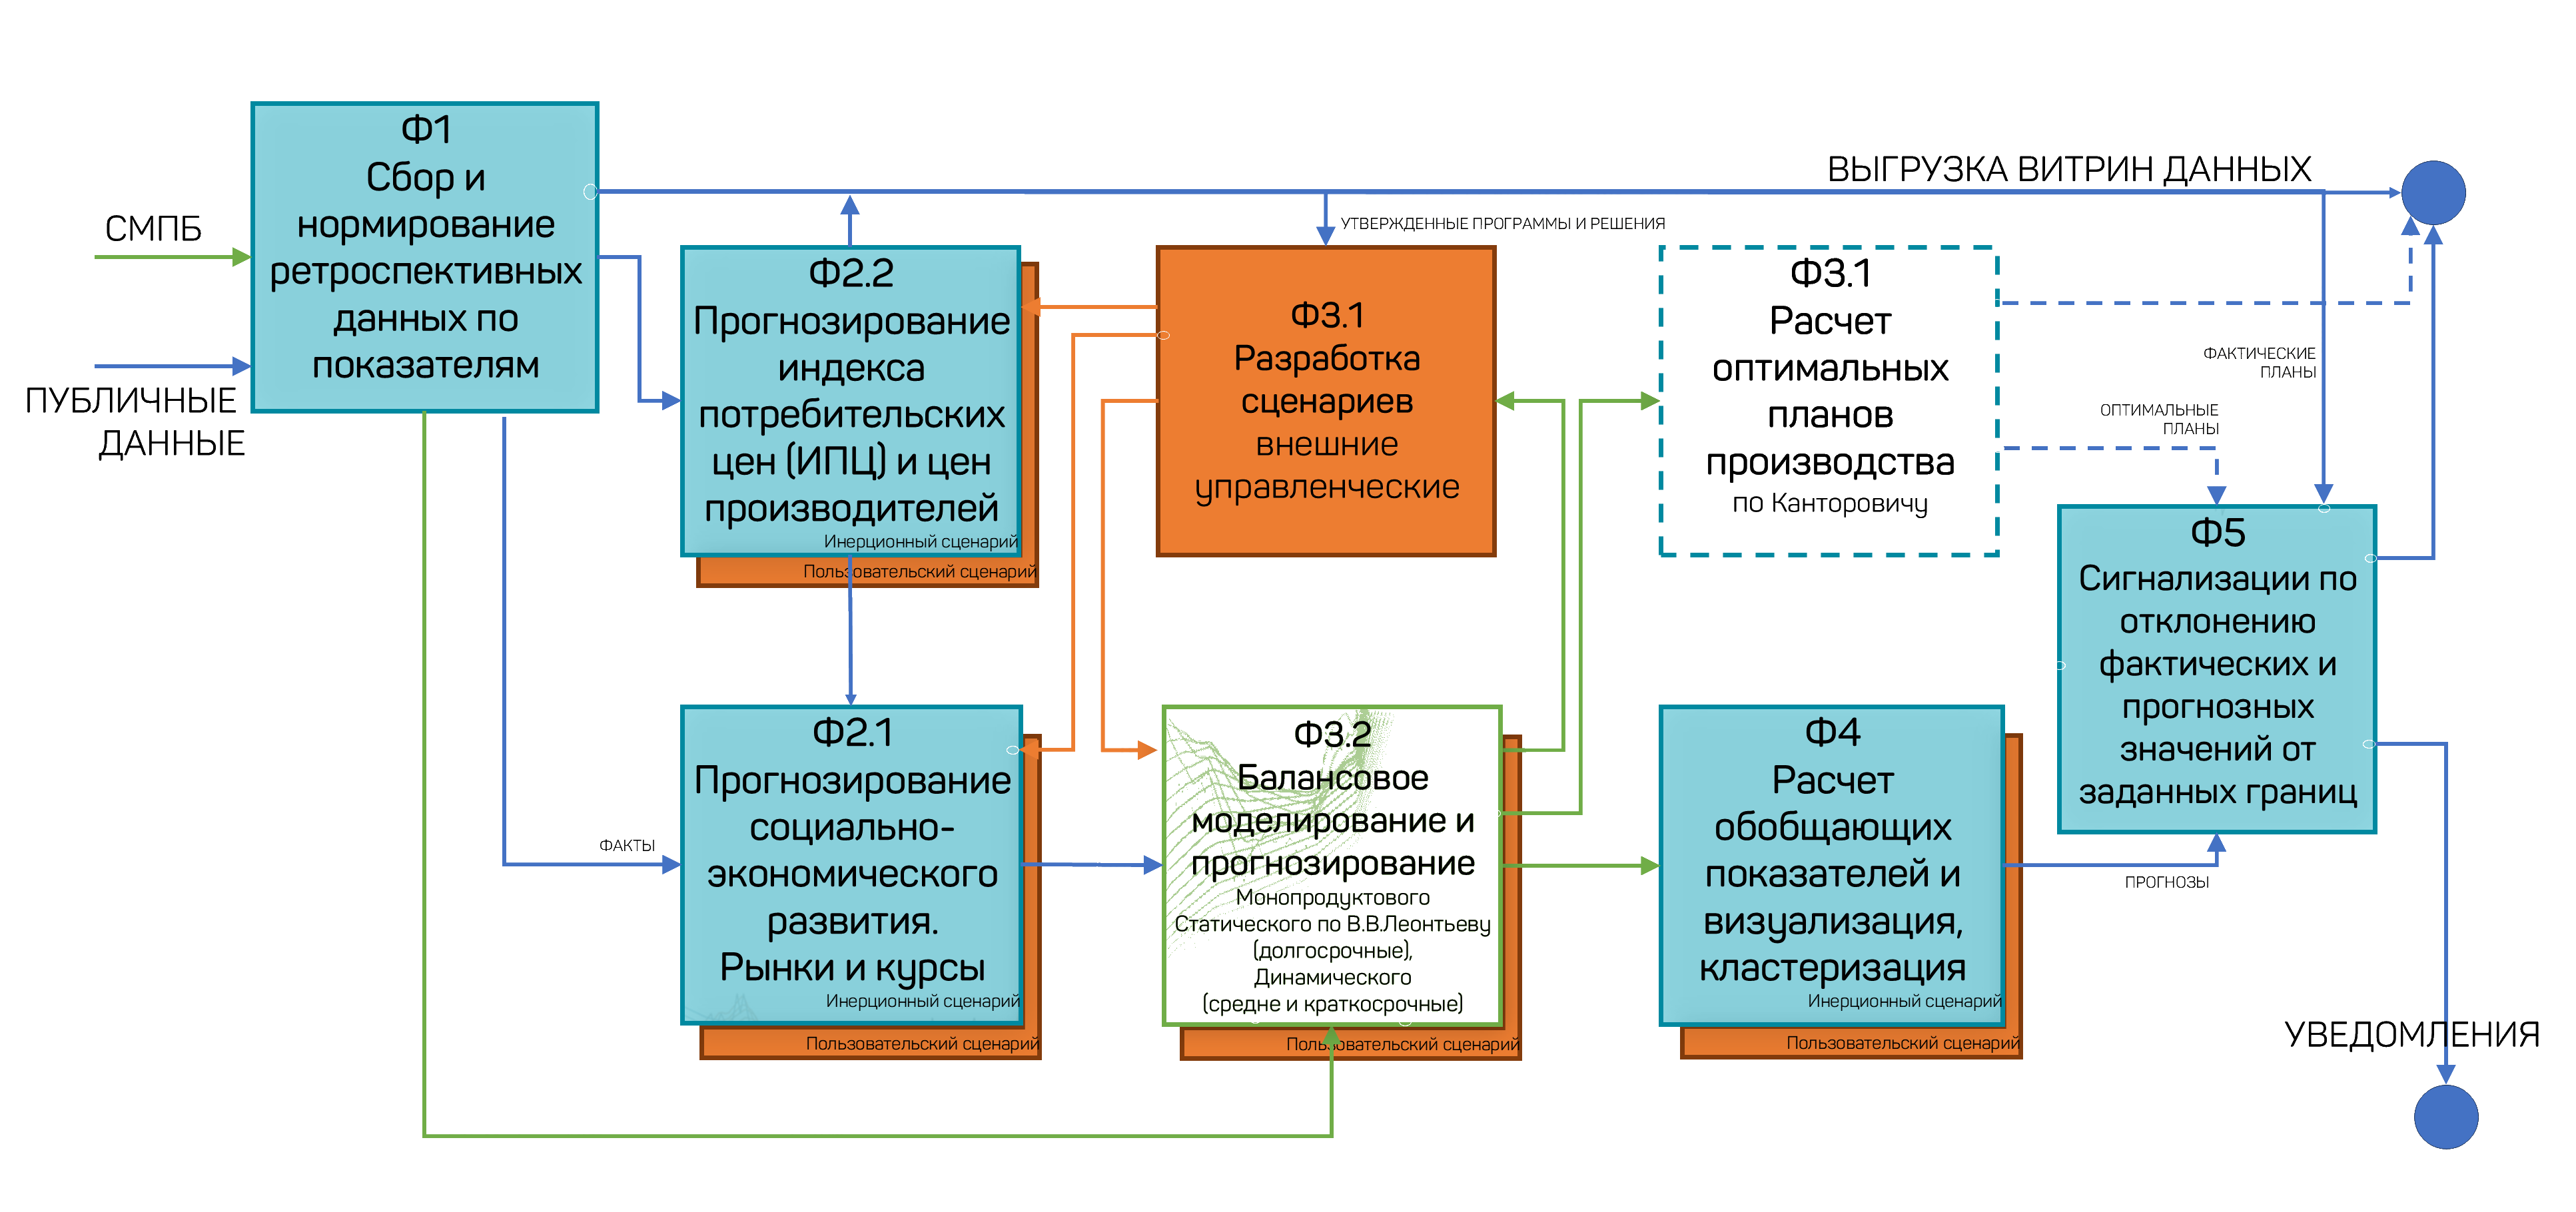
Figure 35 — First-level functional architecture: functions F1–F5
6.10 The implemented analytical loop
In practice, the implemented scheme runs through sequential stages: monitoring (after-the-fact accounting), inertial forecast, impact assessment, scenario modeling (“what happens if”), optimization (“what it takes”), and a system of measures. This gives early warning of risks and pins down coordinated actions to take.
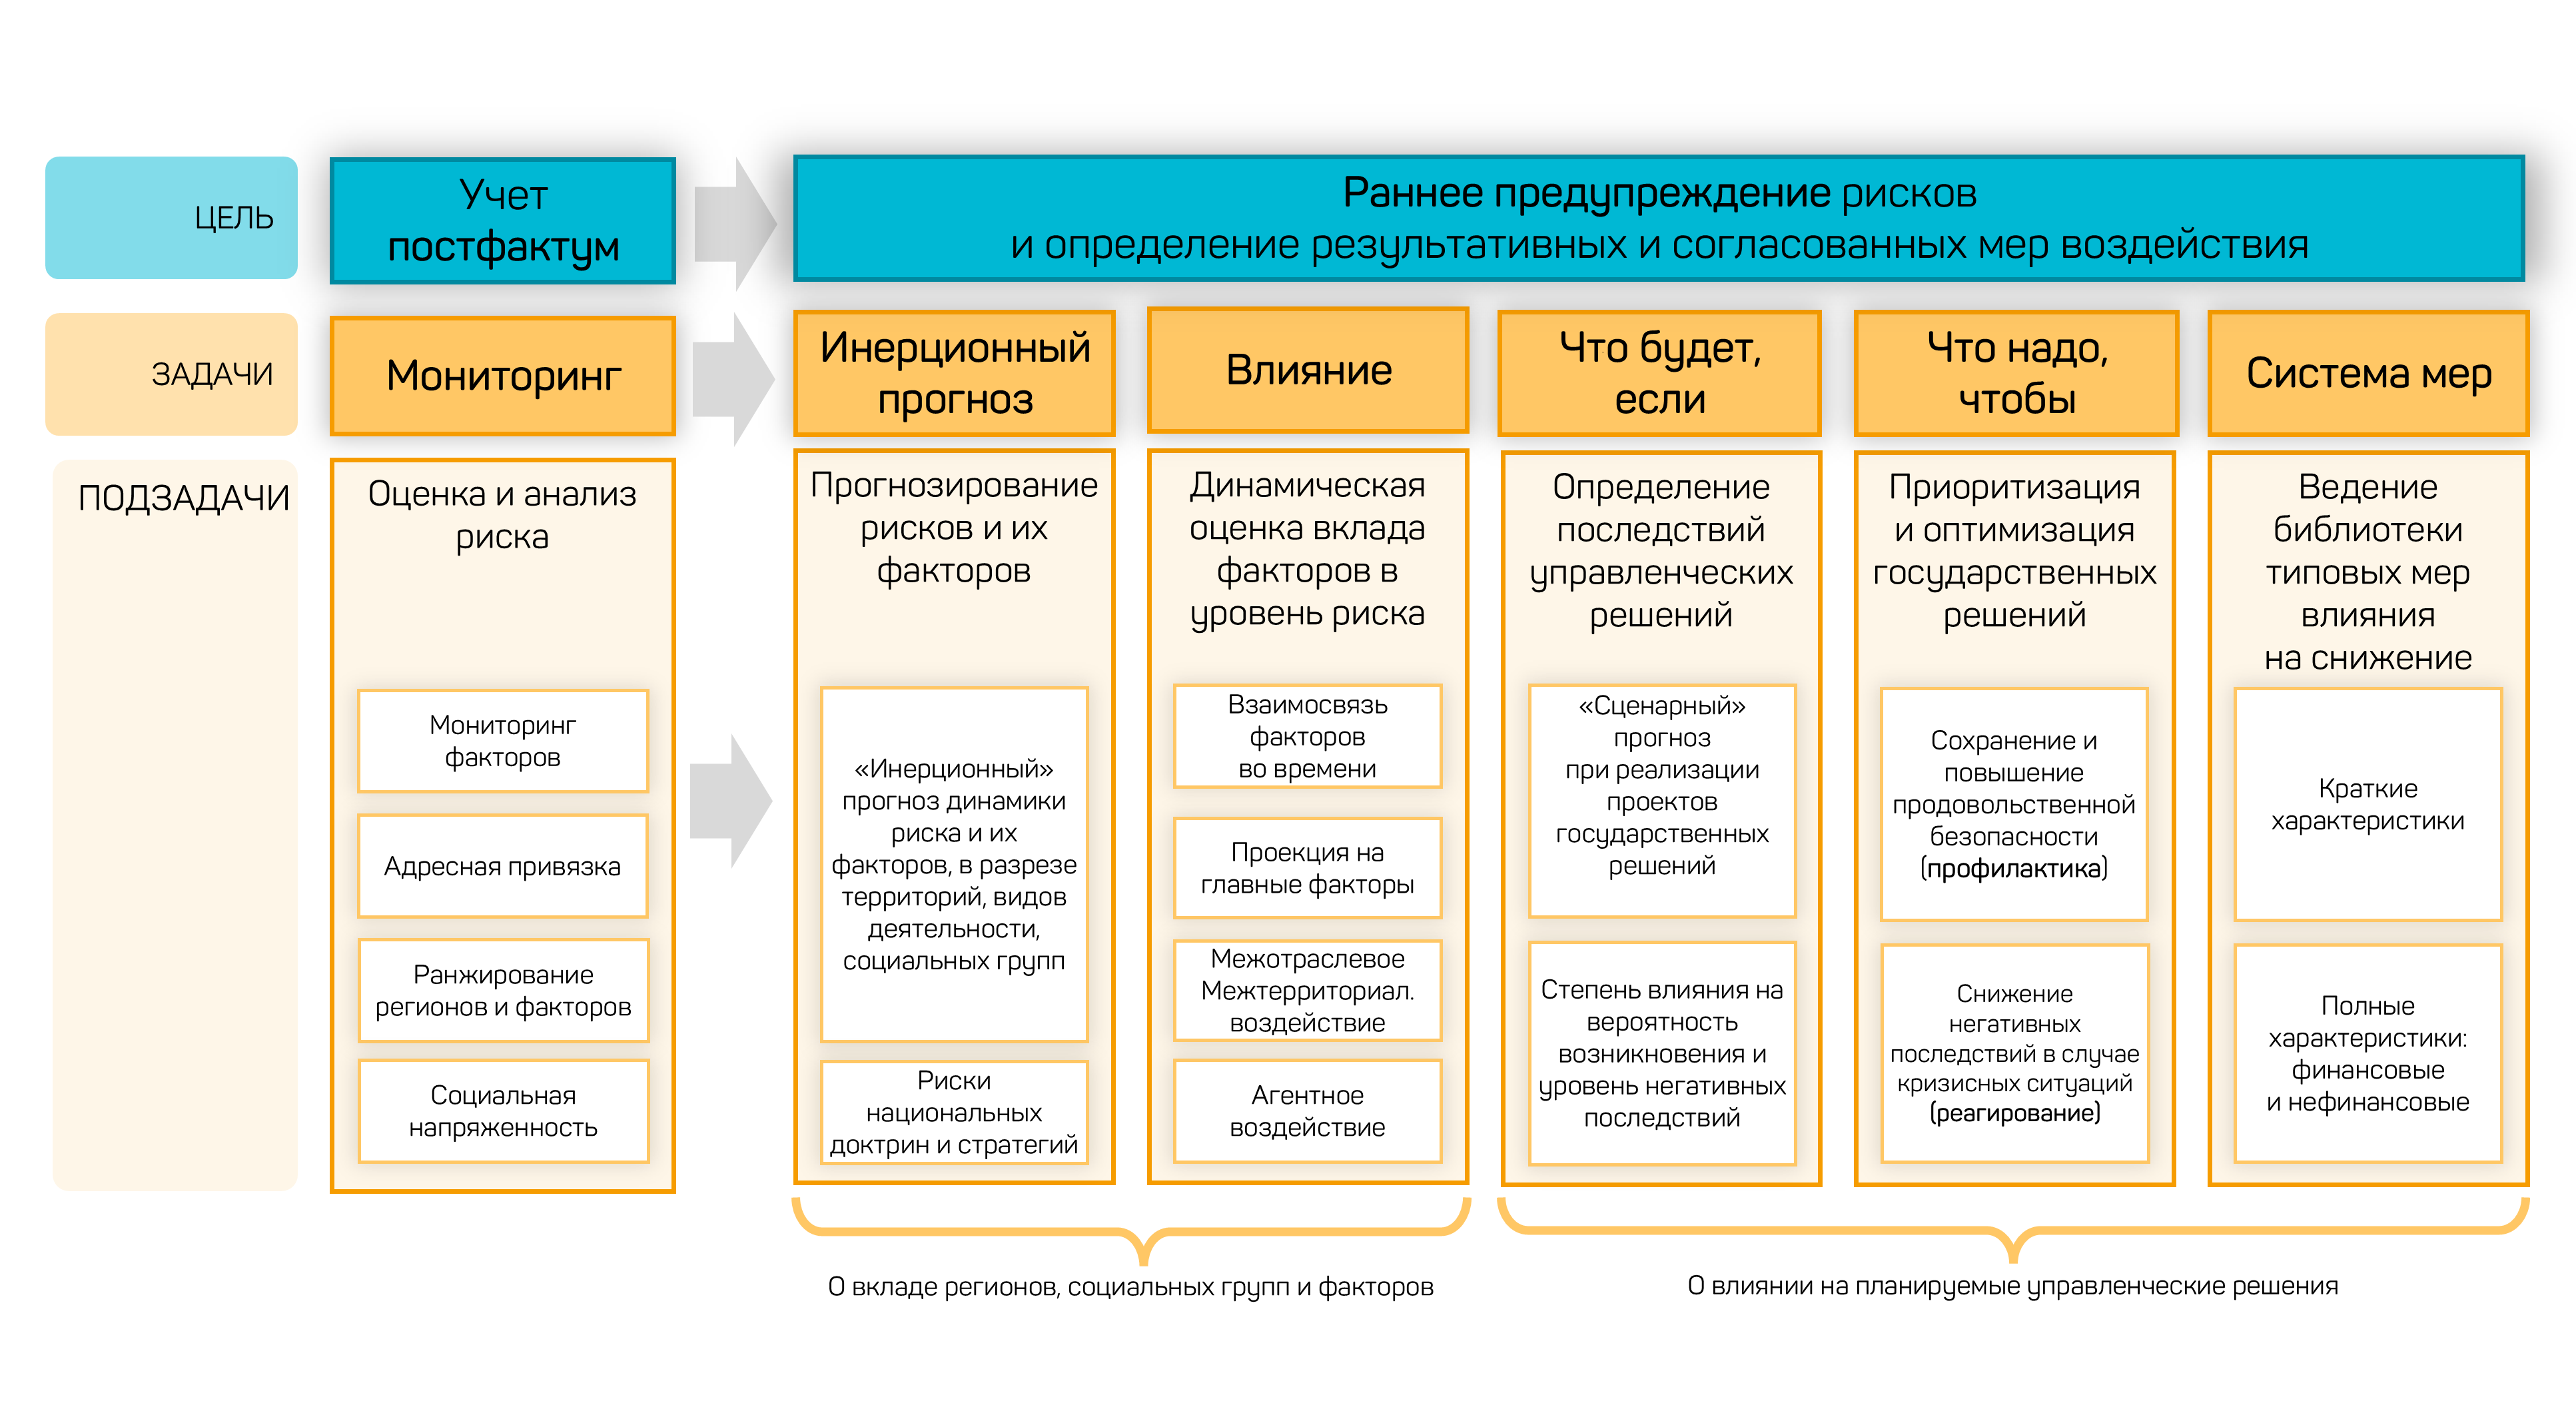
Figure 36 — The implemented scheme: from monitoring to a system of measures