Chapter 9 Results
9.1 How we describe the examples
For each project, we present the following information:
- Industry and scale — a profile of the enterprise and the application area
- Goals — the key problems and objectives behind the rollout
- Solution — the modules and functionality we deployed
- Technologies — the technologies and approaches we used
- Results — the metrics and effects we achieved
9.2 Example 1: Bashkir Soda Company (BSC)
9.2.1 Project overview
Subject: Bashkir Soda Company — the largest producer of soda ash in Russia
Industry: Chemicals (soda ash production)
Scale:
- Production capacity: more than 1 million tons of soda ash per year
- A multi-stage process
- Integration with the enterprise ERP system
- A complex production chain with many processing stages
9.2.2 Goals
The project’s main goals:
1. Build a model of production and business operations (PBO)
- Model every stage of the production process
- Account for process constraints and interdependencies
- Integrate financial and economic indicators
2. Optimize the production program
- Balance output volumes across processing stages
- Optimize equipment utilization
- Minimize product cost
3. Scenario modeling
- Analyze how raw-material price changes affect operations
- Assess the consequences of demand shifts
- Forecast financial results
9.2.3 Solution
Components we deployed:
1. Data management module
- Integration with the corporate ERP system
- Automatic collection of production data
- Consolidation of process and economic indicators
2. Production process modeling module
- A structural-process diagram (SPD) of soda ash production
- Material balances across all processing stages
- Process coefficients and consumption norms
3. Optimization module
- Optimization of the production program
- Capacity balancing
- Cost minimization within the given constraints
4. Scenario analysis module
- Multi-variant calculations
- Sensitivity analysis on parameters
- Forecasting of financial results
Technologies:
- R (Posit) for modeling and calculations
- PostgreSQL for data storage
- Targets to manage calculation nodes
- A REST API for ERP integration
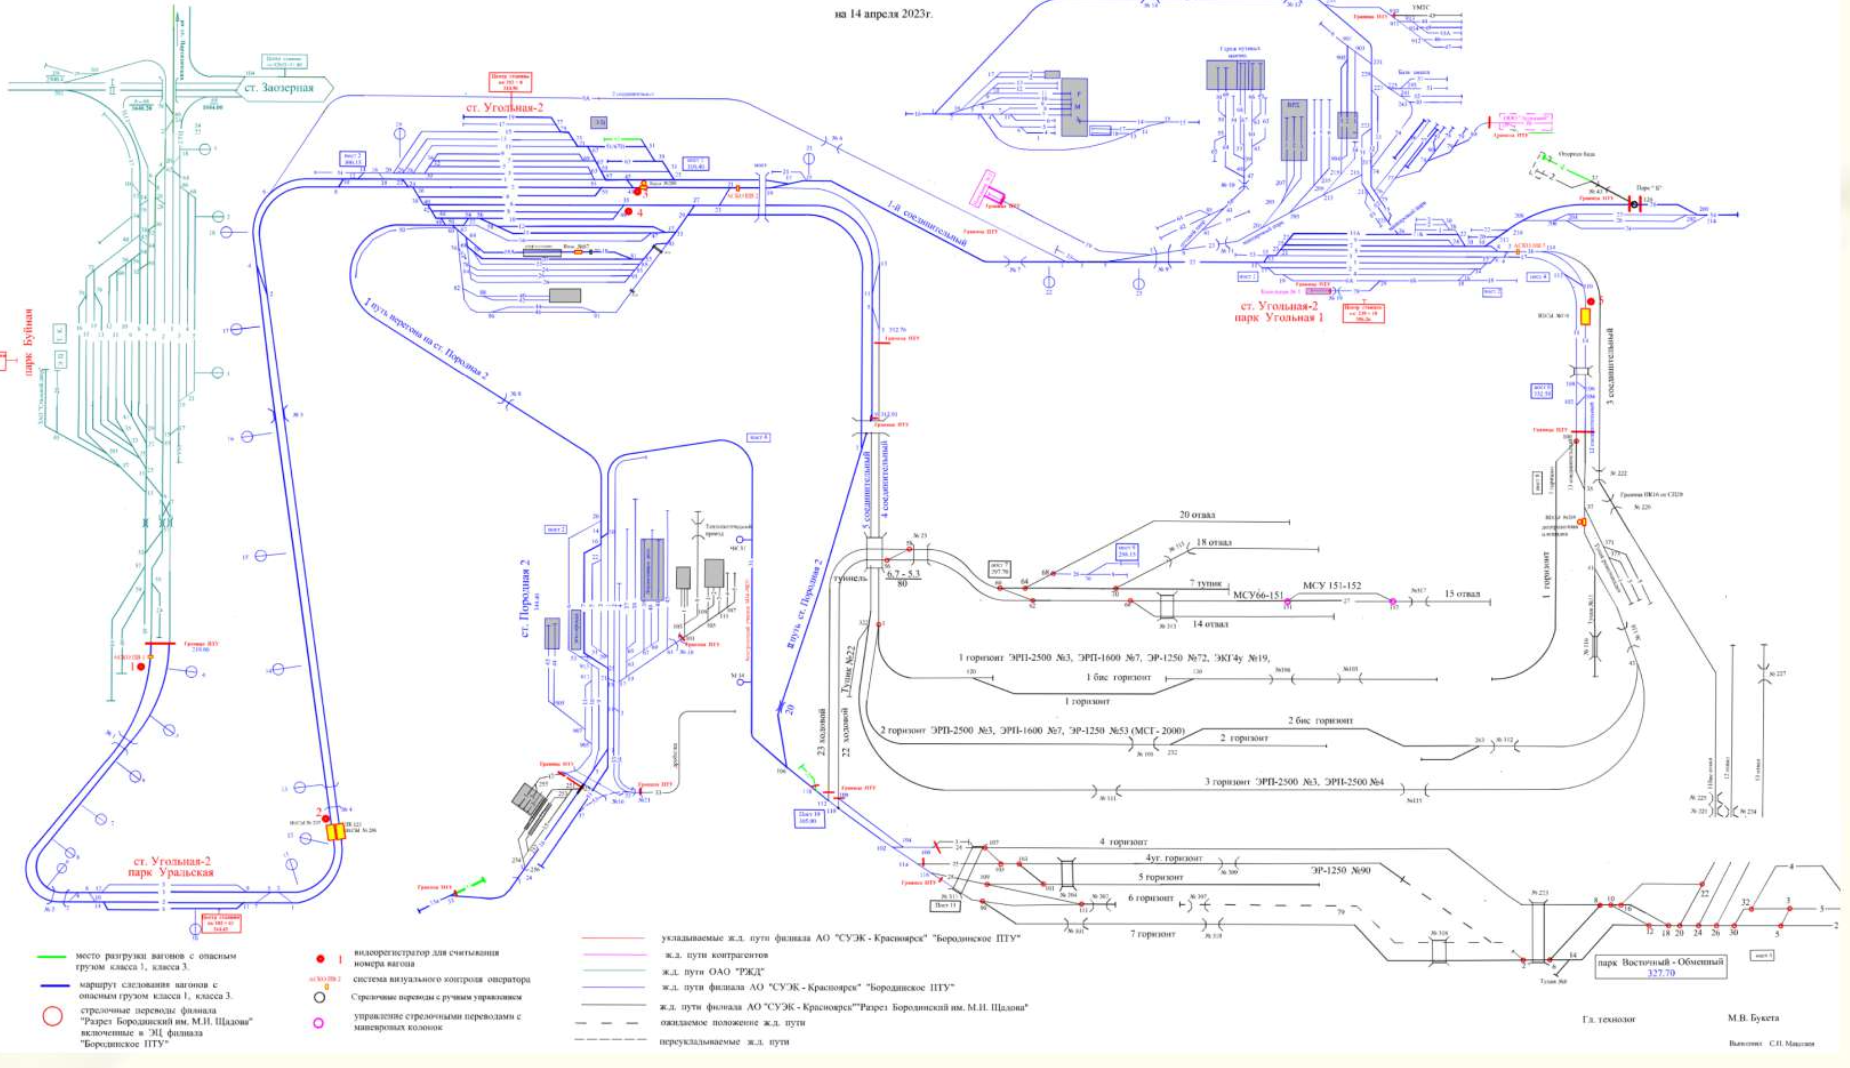
Figure 50 — Structural-process diagram of the BSC production process
9.2.4 Results
The model we built includes:
- A complete structural-process diagram of production
- Material balances across all processing stages
- An economic model that calculates product cost
- Tools to optimize the production program
What it can do:
1. Production planning
- Build an optimal production program
- Balance volumes across processing stages
- Account for capacity and raw-material constraints
2. Cost analysis
- Detailed cost calculation by processing stage
- Factor analysis of variances
- Identification of cost-reduction opportunities
3. Scenario modeling
- Assess how raw-material and product prices affect results
- Analyze the consequences of changing output volumes
- Forecast financial results
Effects of the rollout:
- Automated production planning
- Better-grounded management decisions
- Fast analysis of alternative scenarios
- Transparency in how product cost is formed
- A tool to optimize the production program
Project highlights:
- Handles the specifics of multi-stage chemical production
- Integrates process and economic models
- Scales to other plants in the holding
9.3 Example 2: Elkon Mining and Metallurgical Combine
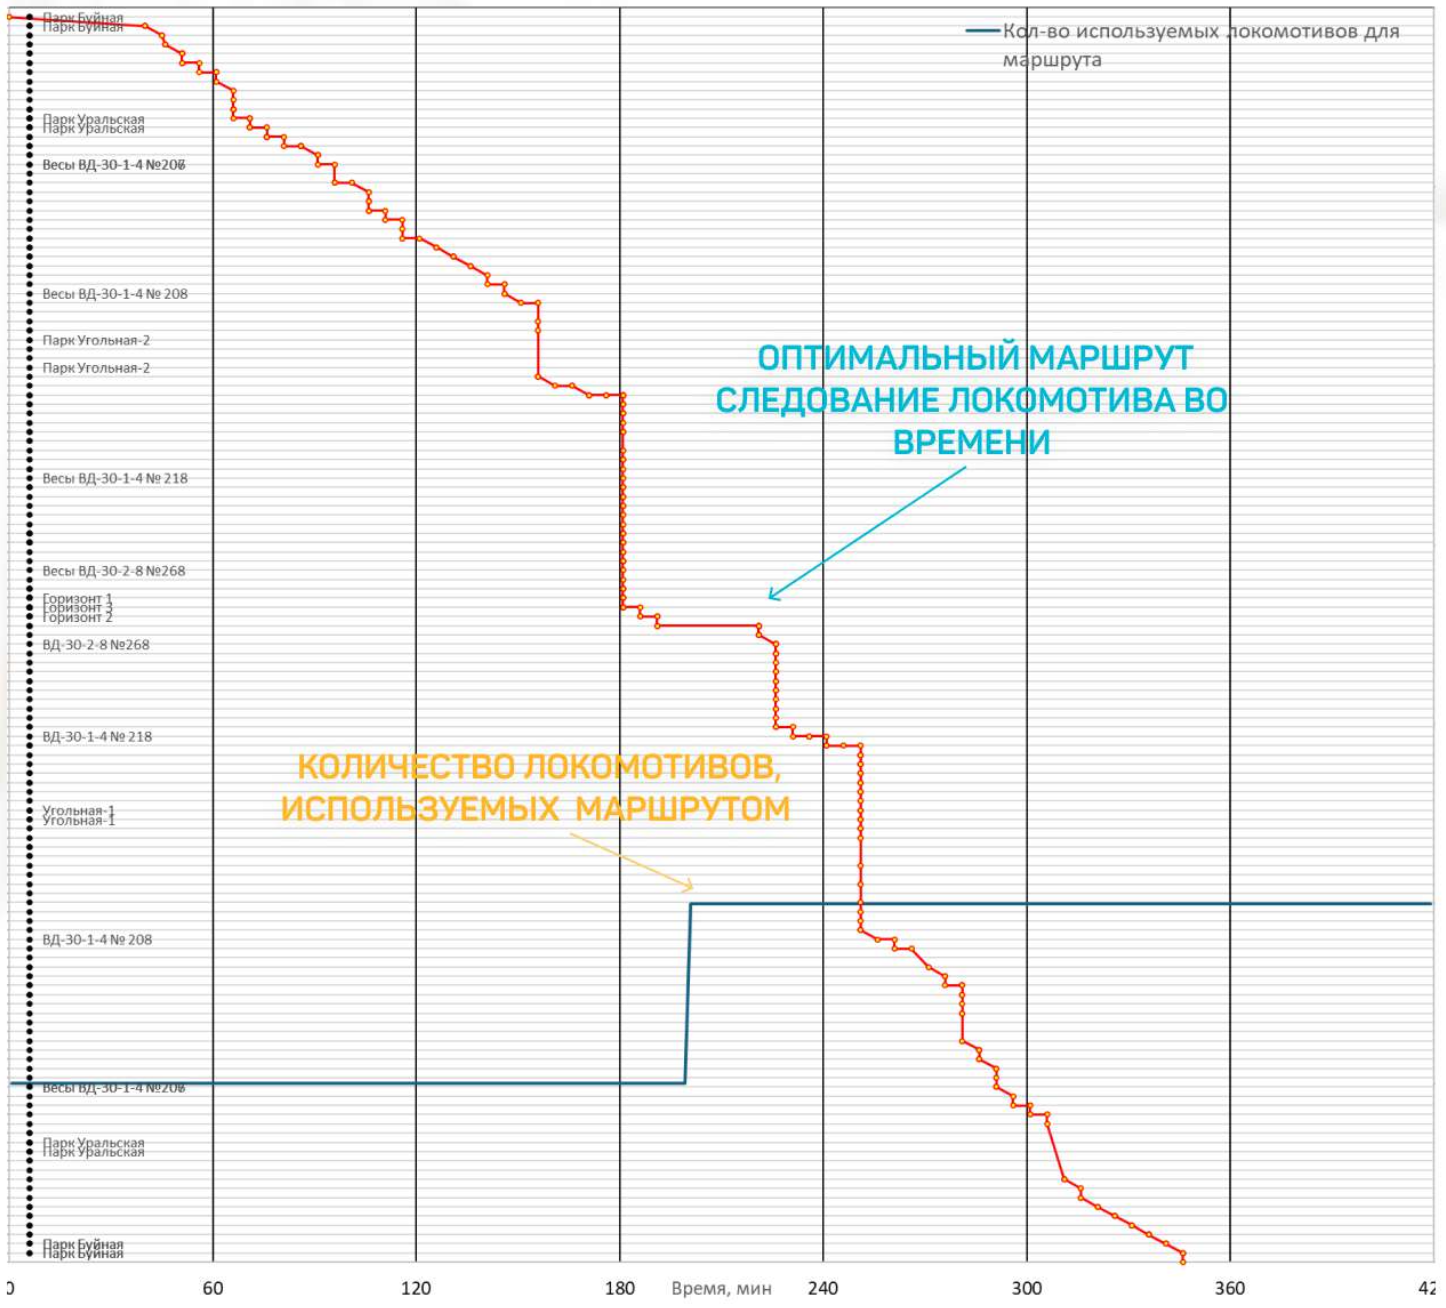
Figure 51 — Optimizing production processes at an industrial enterprise
9.3.1 Project overview
Subject: Elkon MMC — a mining enterprise that extracts and processes uranium ore
Industry: Mining, non-ferrous metallurgy
Scale:
- A large mining enterprise
- The full cycle: from ore extraction to concentrate production
- A complex process chain
- Many production stages
9.3.2 Goals
The project’s main goals:
1. Build an enterprise digital twin
- Model every stage of the production process
- From ore extraction to finished product
- Account for geological, process, and economic factors
2. Optimize the production program
- Plan extraction and processing volumes
- Optimize equipment utilization
- Balance production capacities
3. Manage product cost
- Detailed cost calculation by processing stage
- Identification of cost-reduction opportunities
- Factor analysis of variances
4. Scenario modeling
- Analyze how product price changes affect operations
- Assess the consequences of changing extraction volumes
- Forecast financial results
9.3.3 Solution
Components we deployed:
1. Data management module
- Integration with corporate information systems
- Collection of data on extraction, processing, and sales
- Consolidation of geological, process, and economic information
2. Mining production modeling module
- A structural-process diagram (SPD) of the entire production cycle
- Ore-extraction models that account for geological conditions
- Beneficiation and processing models
- Material balances across all processing stages
3. Optimization module
- Optimization of the production program
- Planning of extraction and processing volumes
- Optimization of beneficiation equipment utilization
4. Economic analysis module
- Cost calculation by processing stage
- Production profitability analysis
- Forecasting of financial results
Technologies:
- R (Posit) for modeling and calculations
- PostgreSQL for data storage
- ClickHouse for time-series analytics
- Targets to manage calculation nodes
- A REST API for integration with corporate systems
9.3.4 Results
The model we built includes:
- A complete structural-process diagram of production
- Ore-extraction models that account for geological parameters
- Beneficiation and processing models
- Material balances across all processing stages
- An economic model that calculates product cost
- Tools to optimize the production program
What it can do:
1. Plan extraction and processing
- Build an optimal production program
- Plan extraction volumes against geological conditions
- Balance beneficiation capacities
2. Manage product cost
- Detailed cost calculation by processing stage
- Factor analysis of variances from planned indicators
- Identification of cost-reduction opportunities
3. Scenario modeling
- Assess how product prices affect results
- Analyze the consequences of changing output volumes
- Forecast financial results under various scenarios
Effects of the rollout:
- Automated production planning
- Better-grounded management decisions
- Fast analysis of alternative scenarios
- Transparency in how product cost is formed
- A tool to optimize the production program
- Handling of mining-specific requirements
Project highlights:
- Accounts for geological factors when planning extraction
- Models a complex process chain
- Integrates extraction, beneficiation, and processing models
- Scales to other deposits
9.4 Example 3: Leto — order automation with machine learning
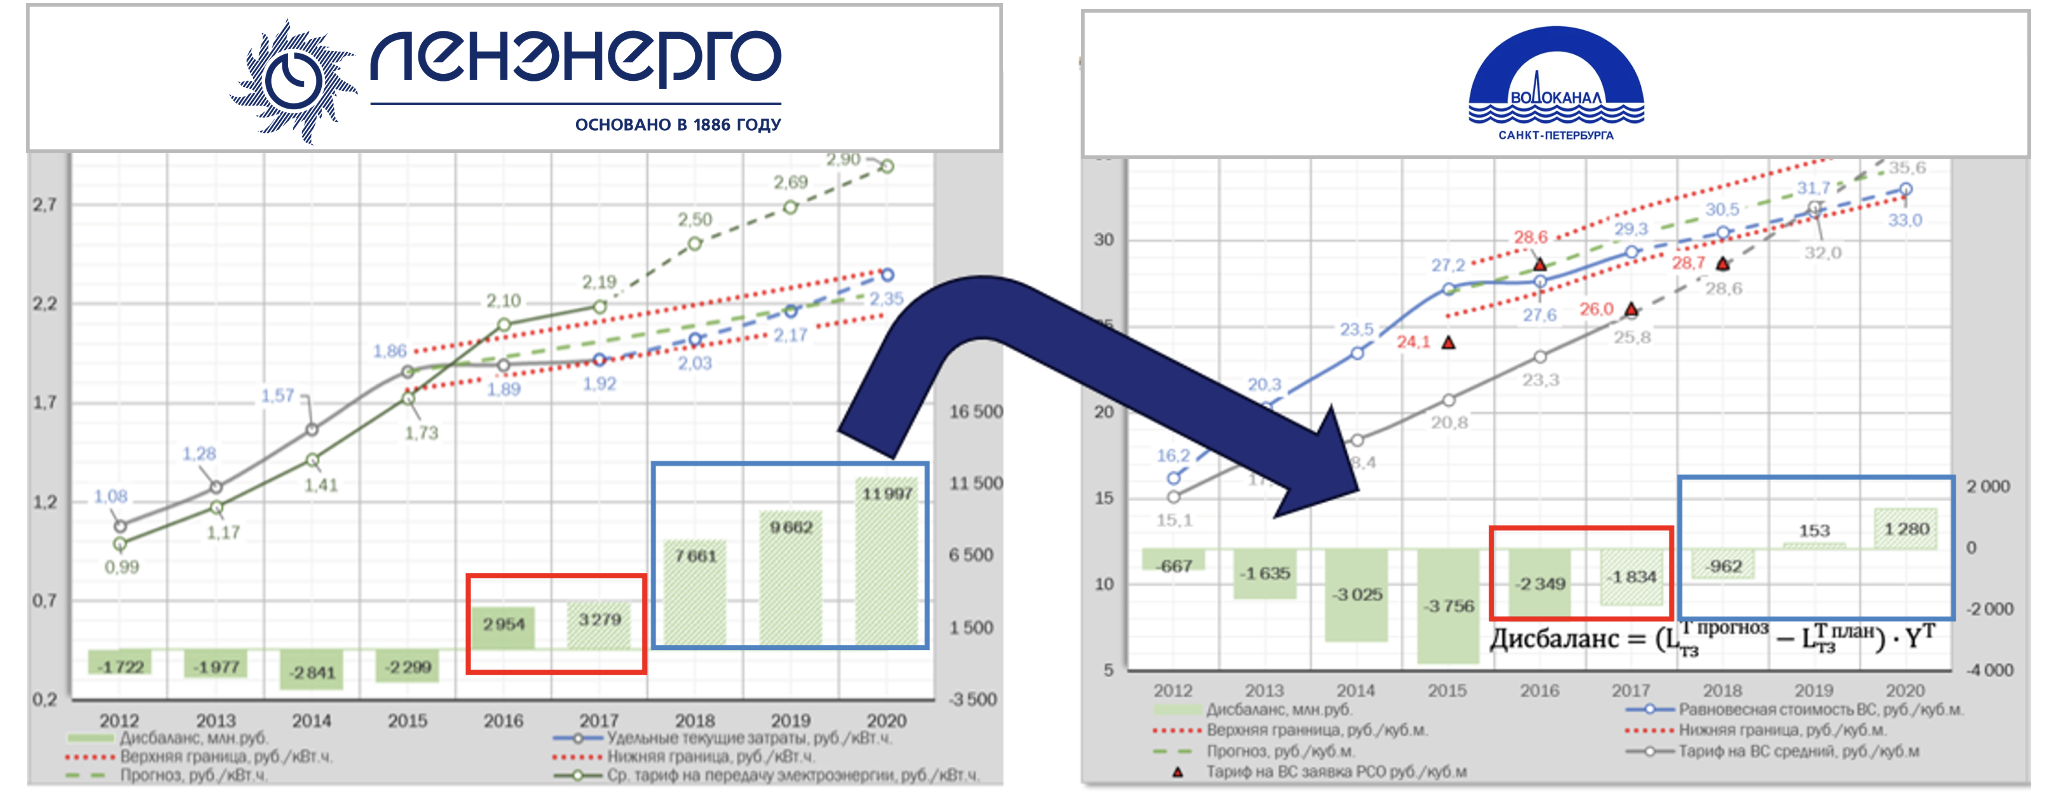
Figure 52 — Supply chain and inventory management visualization
9.4.1 Project overview
Subject: An order automation system for an industrial enterprise
Goal: Automate how the company places orders for raw materials and supplies, using machine learning
Scale:
- Many stock-keeping units
- Various suppliers and delivery terms
- Complex logistics and warehousing
- The need to weigh many factors when placing orders
9.4.2 Goals
The project’s main goals:
1. Forecast material demand
- Analyze historical consumption data
- Account for seasonality and trends
- Forecast future needs
2. Optimize order parameters
- Determine the optimal order size
- Choose the best time to place an order
- Account for delivery terms and discounts
3. Automate the ordering process
- Generate orders automatically
- Integrate with supplier systems
- Track order fulfillment
4. Manage inventory
- Optimize stock levels
- Minimize storage costs
- Prevent material shortages
9.4.3 Solution
Components we deployed:
1. Demand forecasting module
- Machine learning methods to forecast demand
- Time-series analysis
- Accounting for multiple factors (seasonality, trends, external factors)
2. Order optimization module
- Algorithms that optimize order size and timing
- Accounting for delivery terms and transportation costs
- A balance between storage costs and shortage risk
3. Automation module
- Automatic order generation based on forecasts
- Integration with the enterprise ERP system
- API integration with supplier systems
4. Inventory management module
- Real-time monitoring of stock levels
- Critical-level monitoring
- Alerts when an order needs to be placed
Machine learning technologies:
- Time series (ARIMA, Prophet, LSTM)
- Gradient boosting (XGBoost, LightGBM)
- Ensemble methods
- Automatic selection of the best model
Technology stack:
- Python for the ML models
- R (Posit) for statistical analysis
- PostgreSQL for data storage
- A REST API for integration
9.4.4 Results
What it can do:
1. Demand forecasting
- Automatic forecasting of material demand
- Accounting for seasonality, trends, and external factors
- Continuous retraining of models on new data
2. Order optimization
- Automatic calculation of the optimal order size
- Determination of the best time to place an order
- Accounting for delivery terms and transportation costs
3. Process automation
- Automatic order generation
- Integration with supplier systems
- Tracking of fulfillment and delivery
Effects of the rollout:
- Automated order generation
- More accurate demand forecasting
- Optimized stock levels
- Lower purchasing and storage costs
- Prevention of material shortages
- Less manual effort to manage procurement
Project highlights:
- Uses modern machine learning methods
- Automatically selects the best forecasting model
- Retrains continuously on new data
- Integrates with corporate and supplier systems
- Scales across different product groups
9.5 Example 4: Agriculture analysis and forecasting subsystem (Ministry of Agriculture)
9.5.1 Project overview
Subject: An analysis, modeling, and forecasting subsystem for the Russian Ministry of Agriculture
Industry: Agro-industrial complex (AIC)
Scale:
- 134 consumer-price models for products, with 47 external socio-economic development factors
- 26 producer-price models with 47 external factors
- 7 product-balance models (internal production factors)
- A proactive monitoring dashboard for executives
- Platform deployment on the customer’s side
9.5.2 Solution
For this project, we built consumption and production models for key AIC products. The consumption model captures a two-way link with the region’s socio-economic development factors: population, unemployment rate, average wage, investment, number of enterprises, and other indicators.
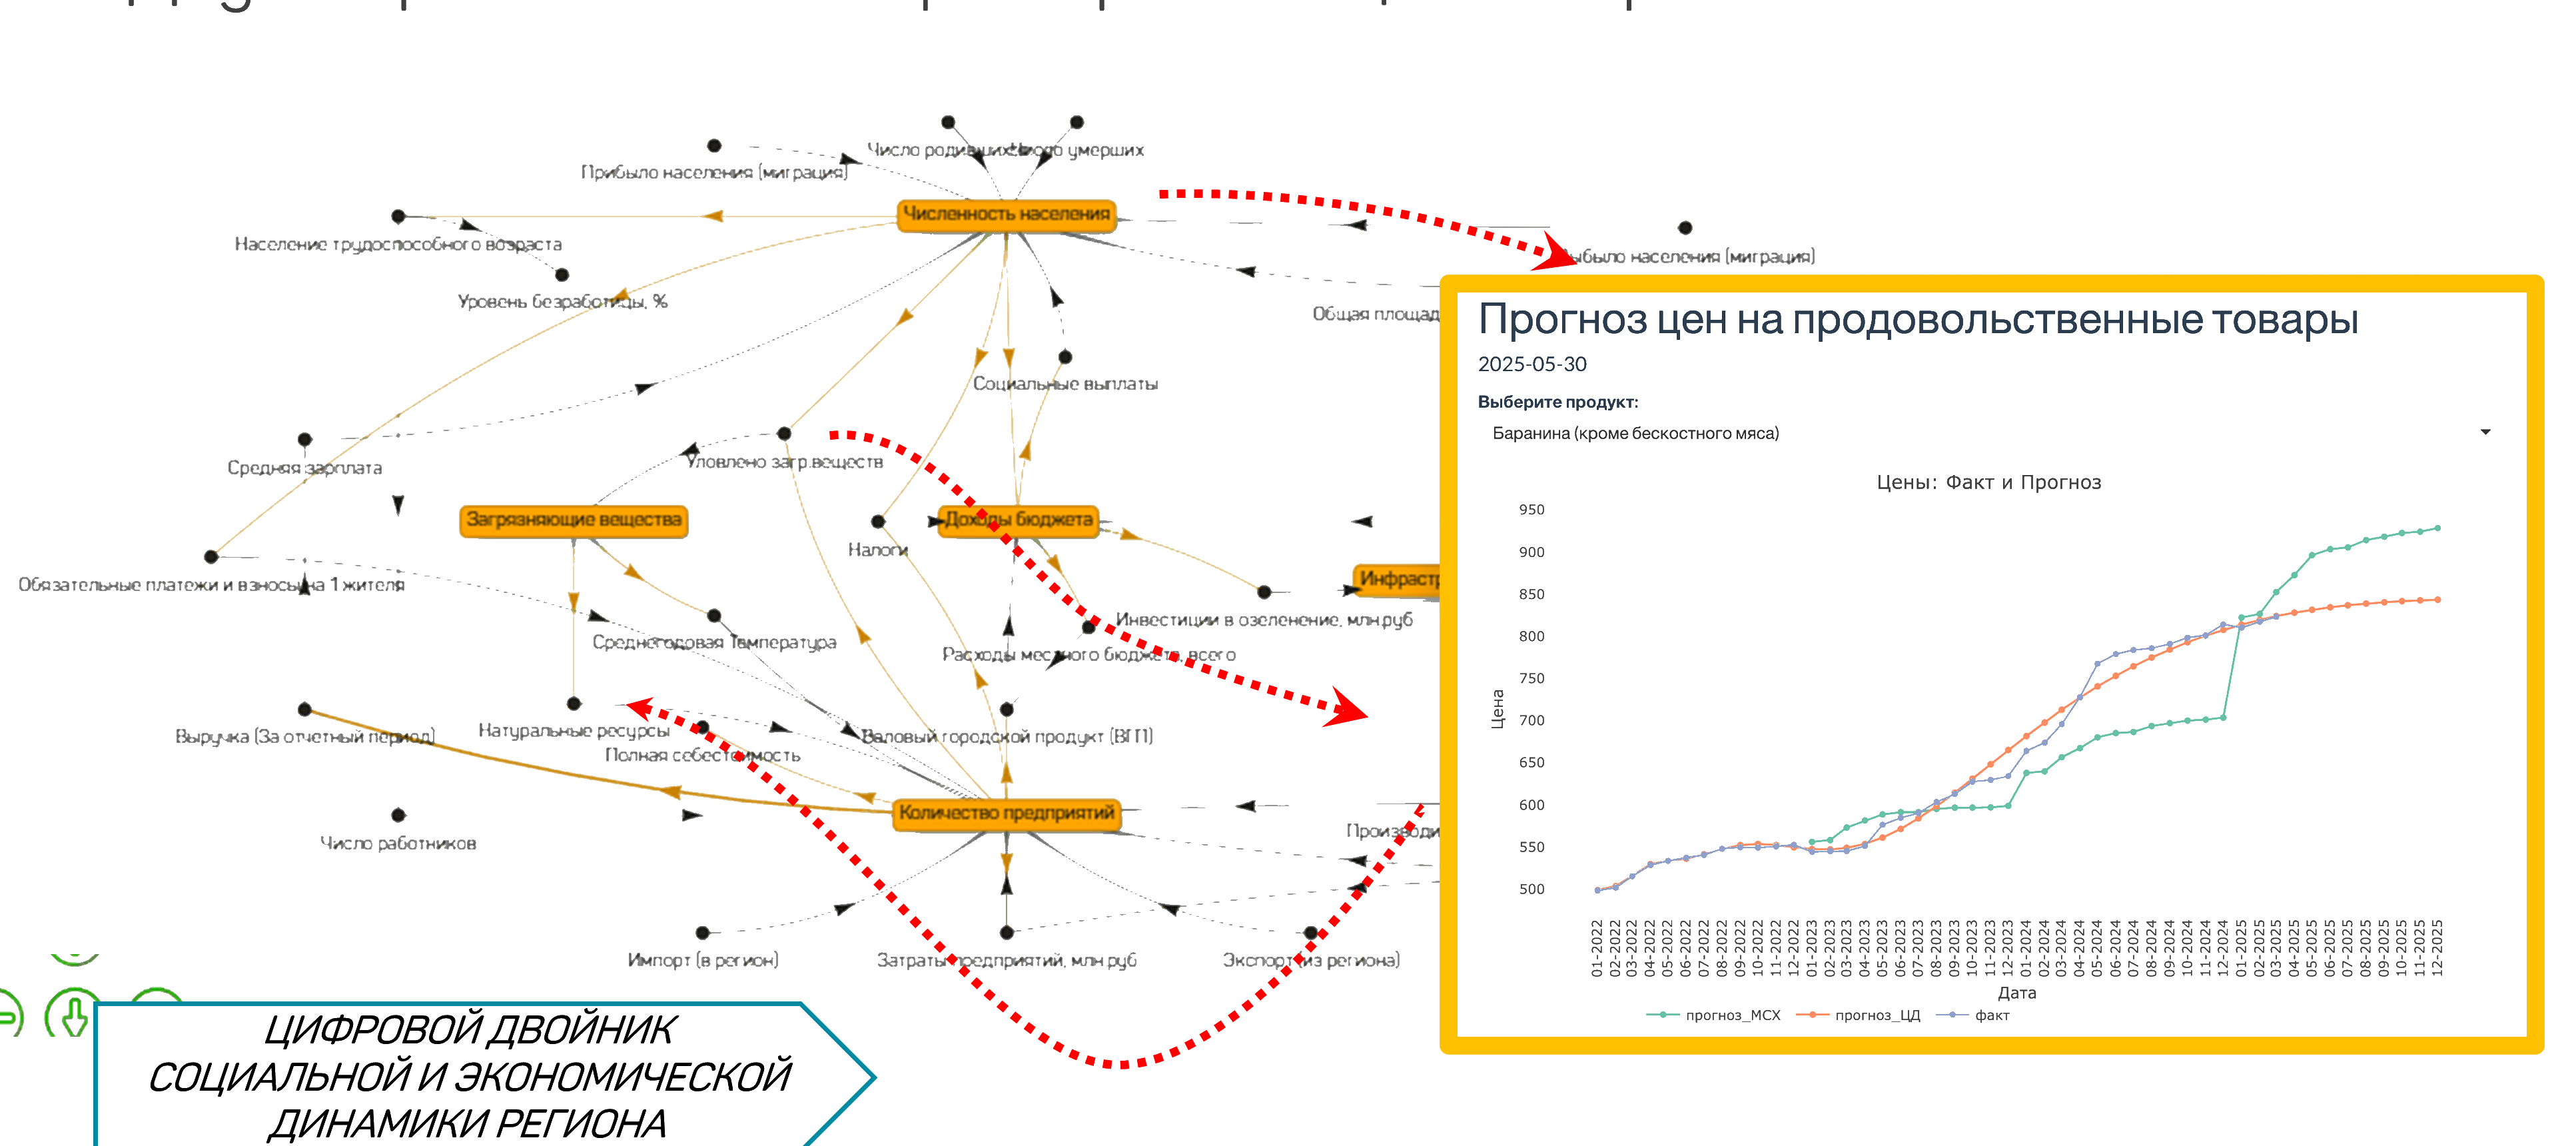
Figure 53 — Consumption model: a two-way link with socio-economic development factors and a price forecast for food products
The balance model, shown here for wheat, includes a production process diagram (IDEF0), output-input balance matrices, and forecast corridors for consumer prices.
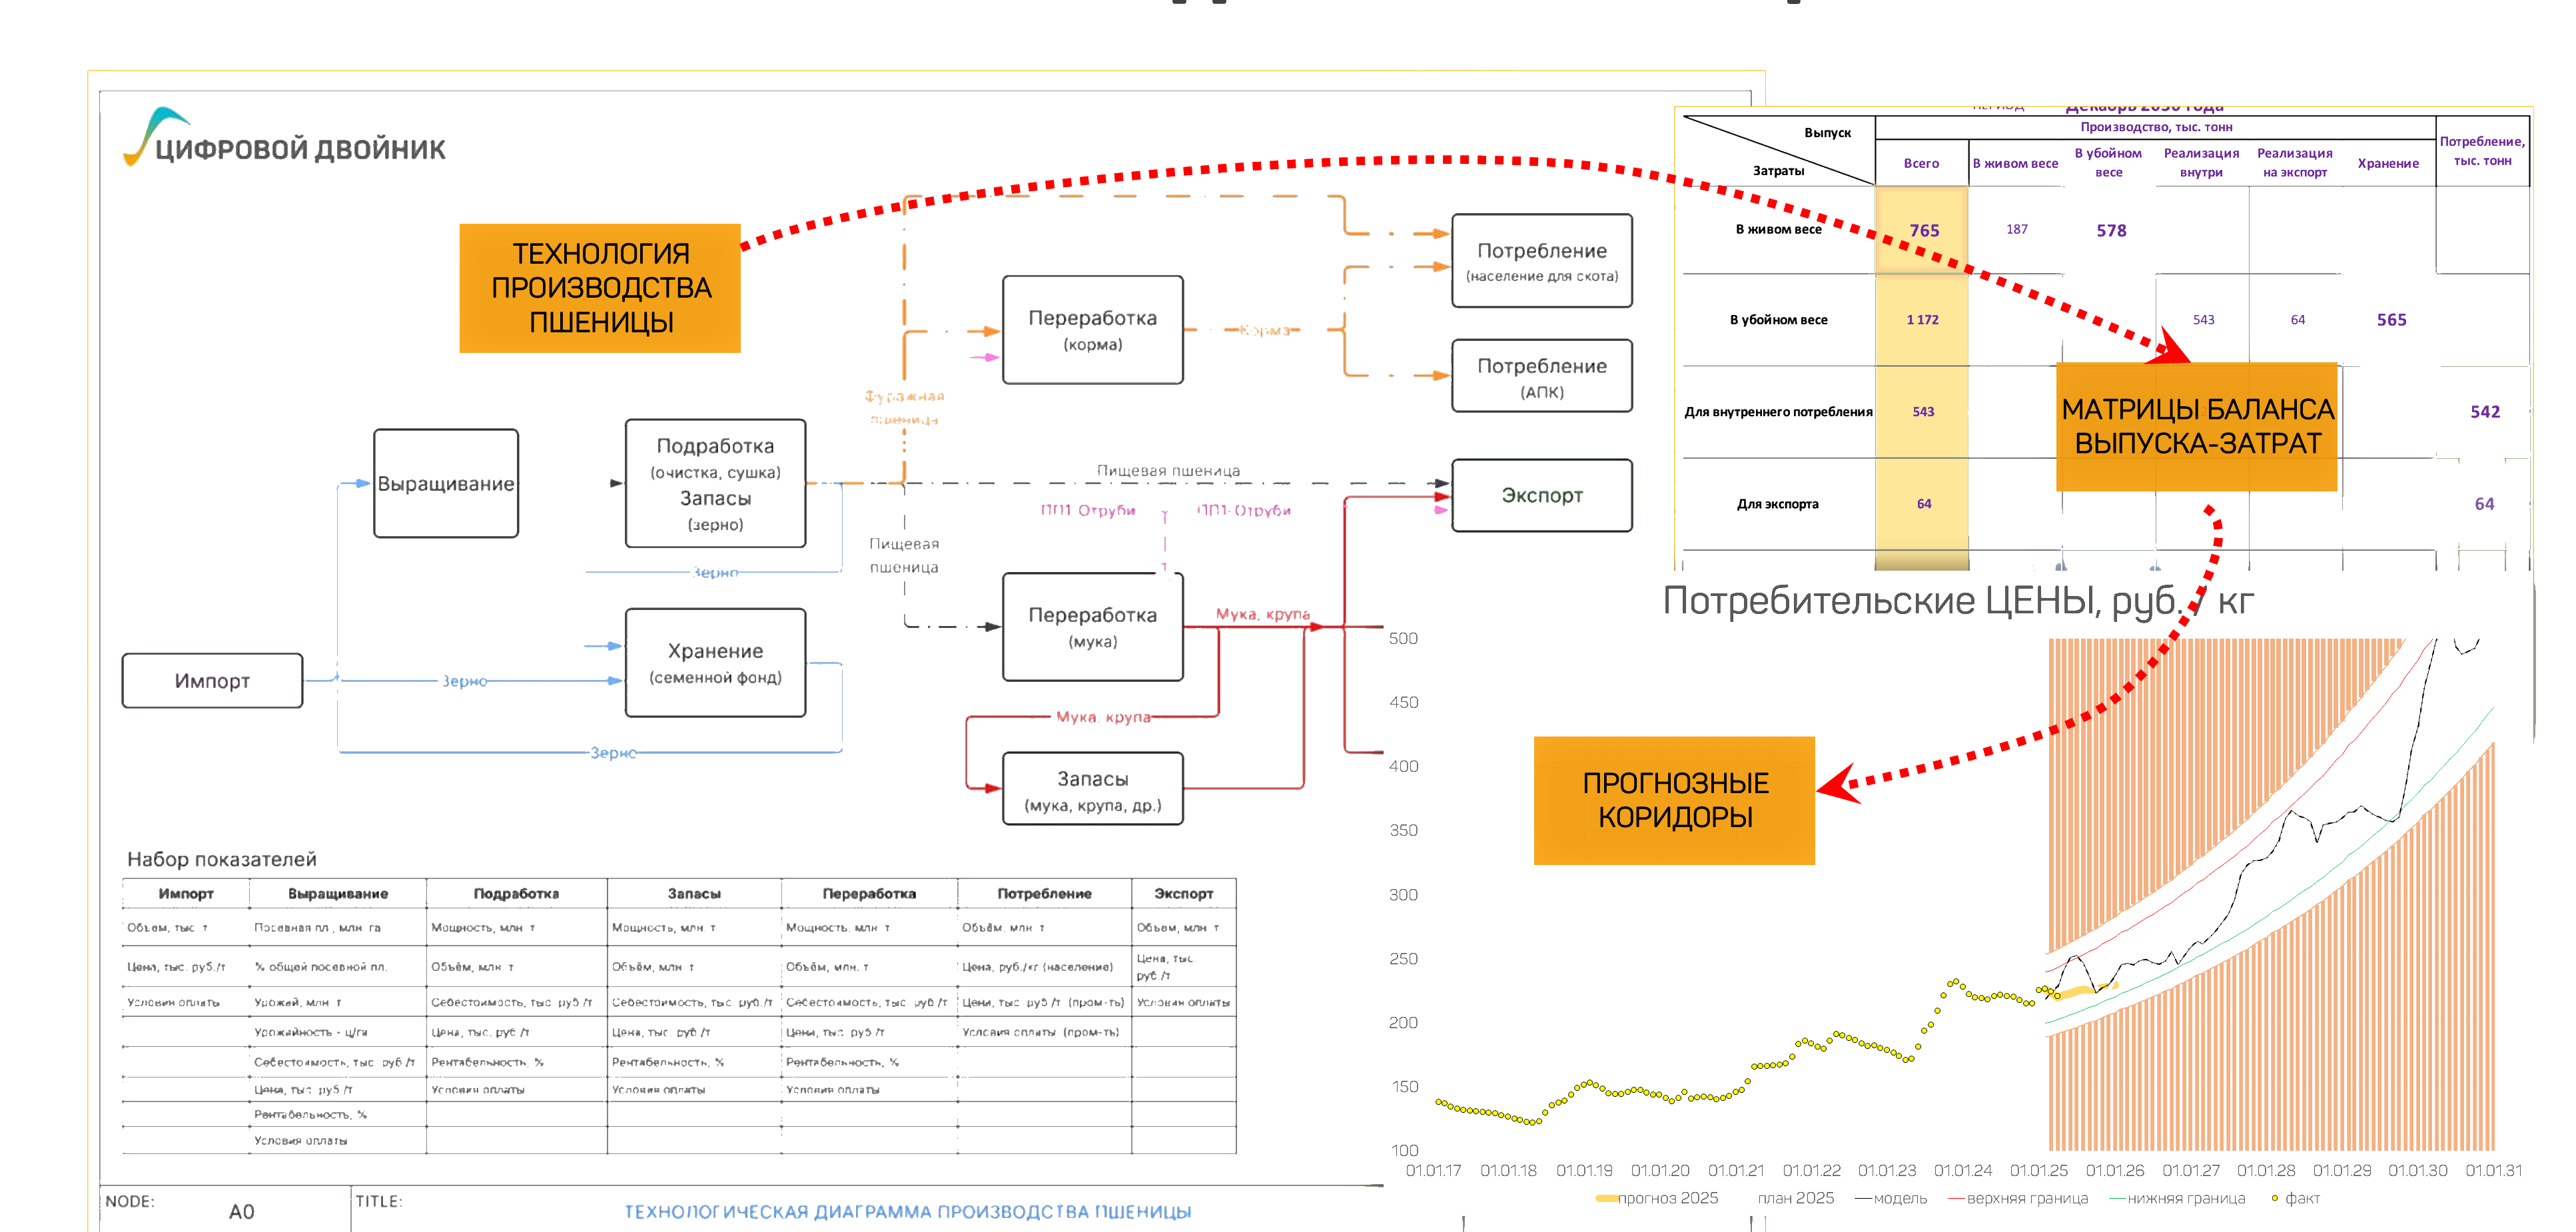
Figure 54 — Example balance model for wheat: process diagram, balance matrices, and price forecast corridors
9.5.3 Results
The platform’s user interface gives access to analytics through an interactive dashboard with production indices, exports, and CPI, broken down by sector: crop farming, livestock, and processing.
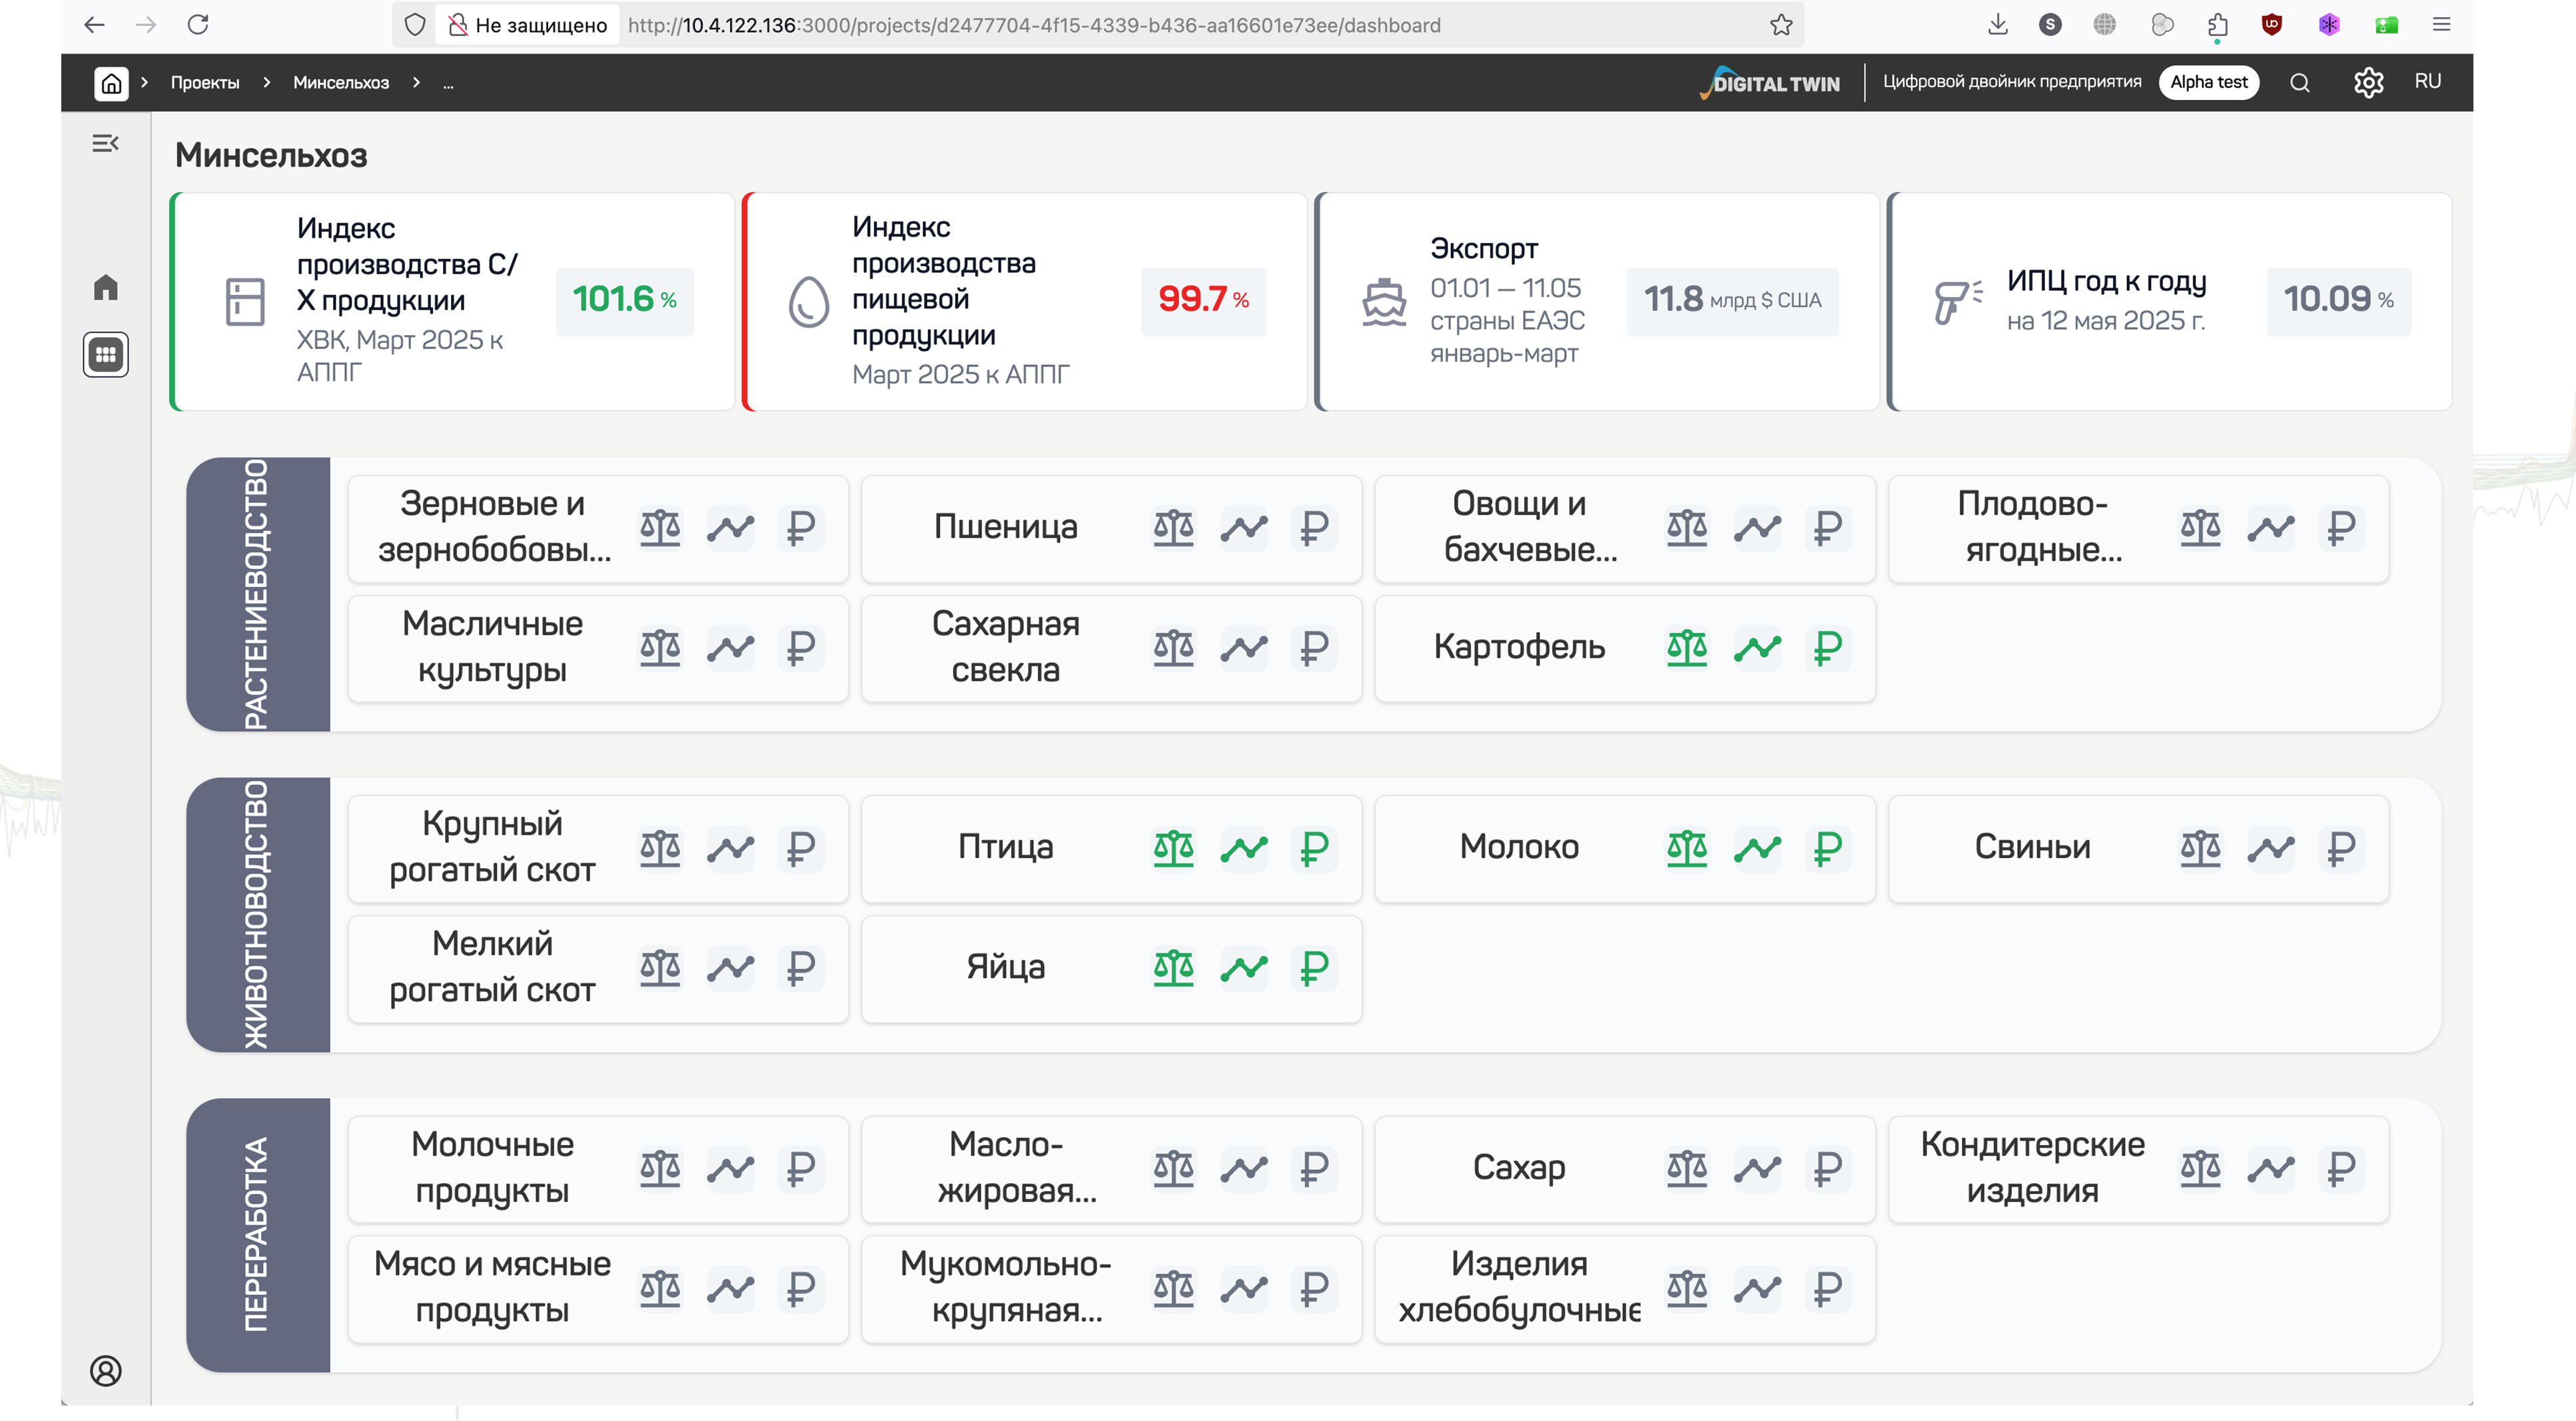
Figure 55 — Ministry of Agriculture dashboard: production indices, exports, and CPI by AIC sector
Production process diagrams — shown here for poultry — are built in an interactive visual editor that lets you define functional blocks, flows, and links, then fill in the balance tables from Google Sheets or files.
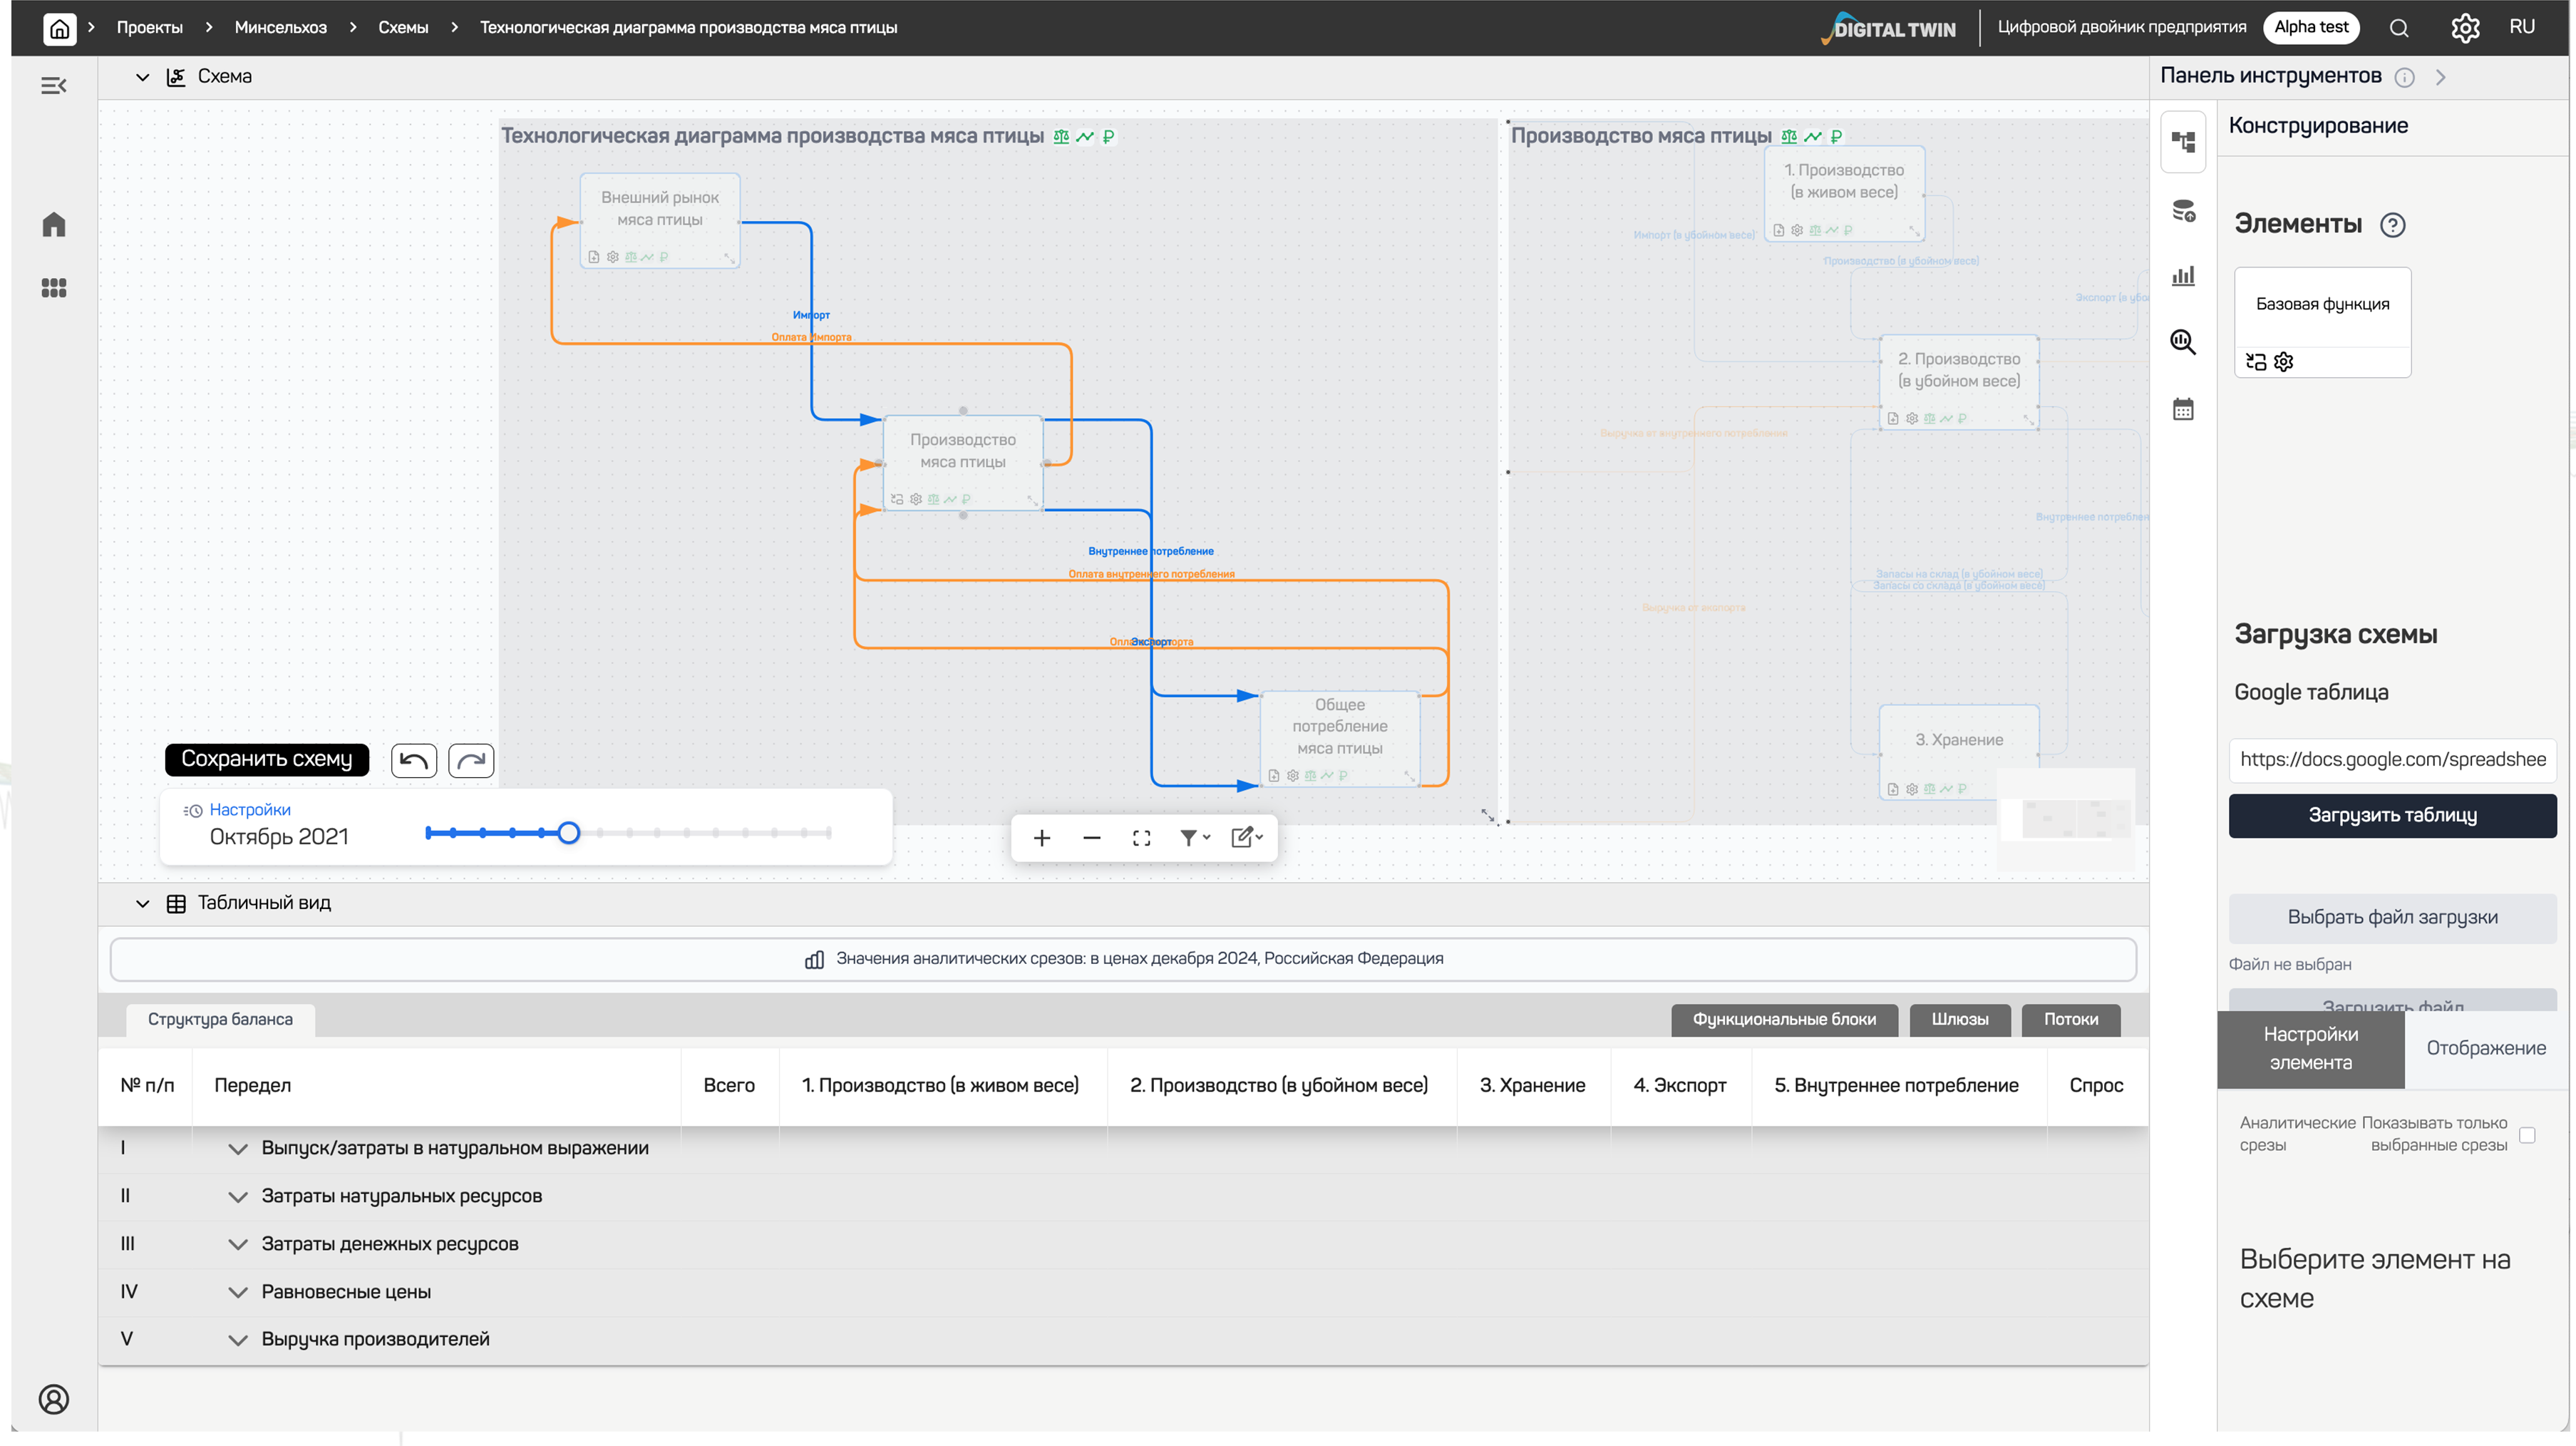
Figure 56 — Process diagram builder for poultry production
The platform visualizes calculation results as charts of output and consumption volumes (thousand tons) and costs and revenue (million rubles), with model corridors — both actual and forecast.
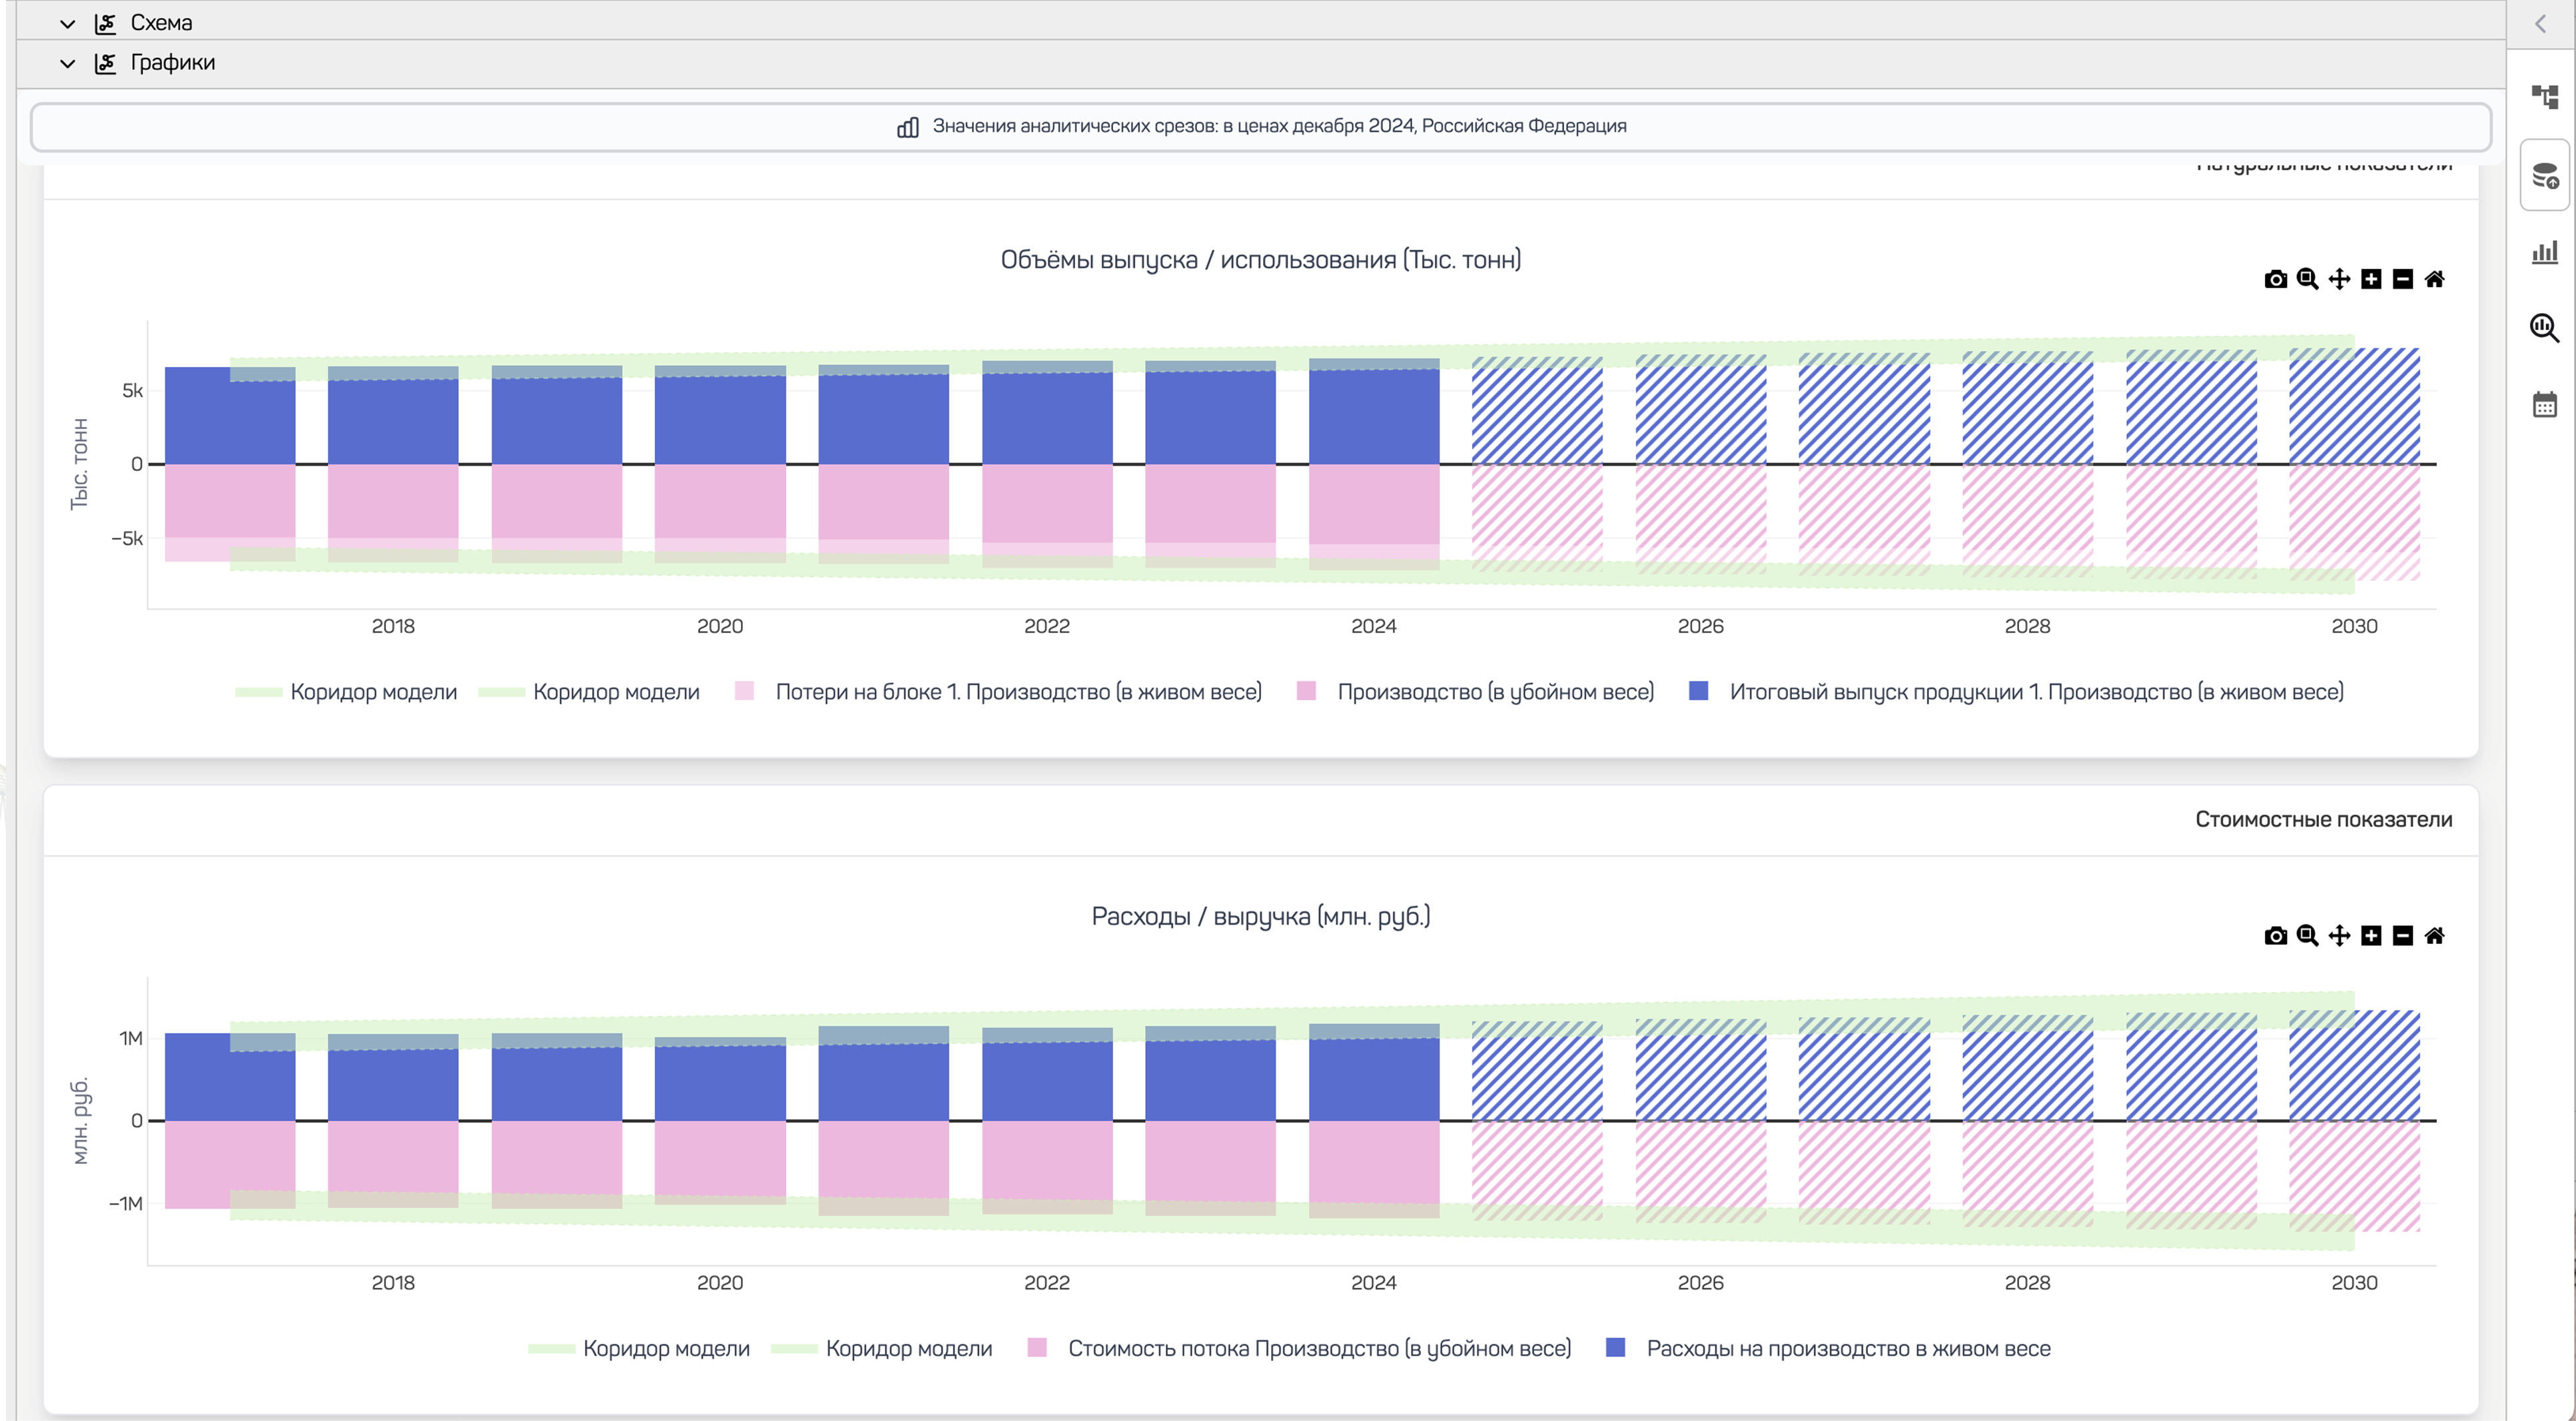
Figure 57 — Charts of output volumes and costs and revenue with model corridors
9.6 Analysis of the projects we delivered
9.6.1 Common project characteristics
Industries covered:
- Chemicals (BSC)
- Mining (Elkon MMC)
- Retail (an auto-ordering system with ML)
- Ferrous metallurgy
- Oil and gas
Types of problems we solved:
1. Production process modeling
- Building structural-process diagrams (SPDs)
- Material balances by processing stage
- Accounting for process constraints
2. Production program optimization
- Planning output volumes
- Capacity balancing
- Cost minimization
3. Cost management
- Detailed calculation by processing stage
- Factor analysis of variances
- Identification of cost-reduction opportunities
4. Scenario modeling
- Analyzing how parameter changes affect operations
- Forecasting financial results
- Risk assessment
5. Machine learning
- Forecasting demand and material needs
- Optimizing order parameters
- Automating decisions
6. Financial modeling and planning
- Automating the planning of business metrics
- Scenario forecasting with version control
- Replacing Excel models with integrated platforms
- Strategic financial planning
- Factor analysis of financial indicators
9.6.2 Project technology stack
Technologies we use:
- R (Posit) for modeling and statistical analysis
- Python for machine learning
- PostgreSQL for structured data storage
- ClickHouse for time-series analytics
- Targets to manage calculation nodes
- A REST API and Kafka for integration with corporate systems
- SAP ERP (integration with customers’ existing systems)
Methods and approaches:
- Resource-balance models
- Optimization models (linear and nonlinear programming)
- Time series (ARIMA, Prophet, LSTM)
- Gradient boosting (XGBoost, LightGBM)
- Scenario modeling
9.7 Key takeaways
9.7.1 Common patterns in successful projects
1. An end-to-end approach
- Integrating process and economic models
- Handling industry- and production-specific requirements
- End-to-end modeling from raw materials to finished product
2. Modularity and scalability
- Phased rollout
- Scaling to other plants
- Adapting to the specifics of each enterprise
3. Integration with corporate systems
- Automatic data collection from ERP/MES
- A REST API for integration
- A single information space
4. Modern technologies
- R (Posit) for modeling
- Python for machine learning
- High-performance databases (PostgreSQL, ClickHouse)
- The Targets library to manage calculations
9.7.2 Application areas
Proven effectiveness in:
- Chemicals (multi-stage processes)
- Mining (from extraction to processing)
- Procurement and inventory management (with ML)
- Ferrous metallurgy (production process optimization)
- Oil and gas (financial modeling)
- Production program optimization
- Cost management and financial planning