Chapter 3 Goals of the system
The Enterprise Digital Twin (EDT) platform tackles the fundamental challenges of managing industrial enterprises as the economy goes digital. This chapter lays out the strategic goals behind EDT and explains the reasoning behind them.
3.1 Strategic goals
3.1.1 Build a single digital space for the enterprise
Goal: Bring all enterprise data together into one integrated model for end-to-end management.
EDT integrates the enterprise’s existing methods, models, and databases into a single information and modeling complex, so you can quickly run multi-scenario and optimization calculations of the consequences of management decisions.
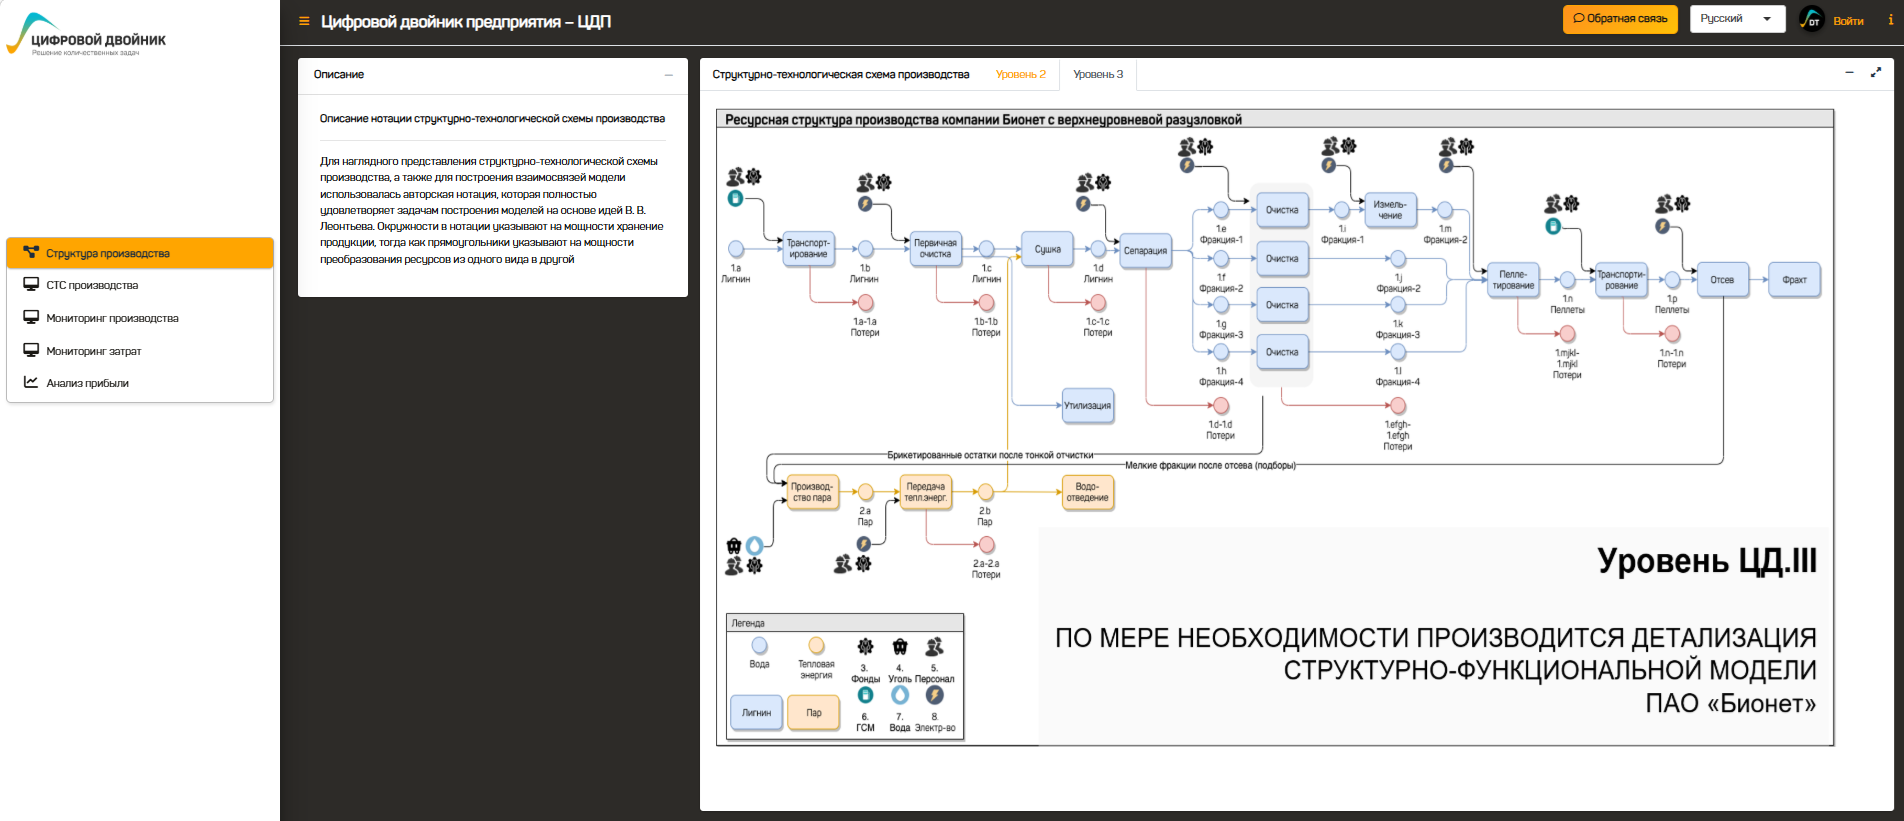
Figure 11 — Structural and technological production diagram in EDT: resource structure with a top-level breakdown
What this delivers:
- a single, real-time view of the enterprise;
- connections between every process and metric;
- end-to-end analytics from raw materials to finished products;
- quick access to current information at every management level.
Result: Leadership and specialists get complete, reliable information to make well-grounded decisions.
3.1.2 Quantitative goals of the rollout
| No. | Goal | Expected result |
|---|---|---|
| 1 | Use resources more efficiently | Cut production costs by 10–15% by optimizing planning, managing inventory, and improving productivity |
| 2 | Increase equipment output | Raise the utilization of production equipment by 15–20% with no extra capital spending, thanks to optimized production chains |
| 3 | Optimize costs and improve profitability | Reduce raw material and energy costs by 10% and raise profitability by 5–7% by automating and monitoring production processes |
| 4 | Launch new products faster | Cut time-to-market for new products by 25% by speeding up planning and production upgrades |
| 5 | Justify and manage investment programs | Increase return on investment by 10% through systematic analysis of investment projects and assessment of their impact on production and financial results |
| 6 | Reduce risks and manage deviations | Reduce production and environmental risks by 15–20% by adopting risk management systems and meeting regulatory requirements |
3.1.3 Make the future predictable and manage risks
Goal: Provide tools to forecast the enterprise’s future states and minimize risks.
What this delivers:
- forecasts of financial results months and years ahead;
- assessment of how market changes affect the enterprise;
- analysis of risks and opportunities;
- testing decisions on a digital model before you implement them;
- spotting negative consequences early;
- assessment of resilience to external shocks;
- selection of the least risky options.
Result: The enterprise is ready for change, can adapt its strategy ahead of time, and lowers the chance of costly mistakes by 15–20%.
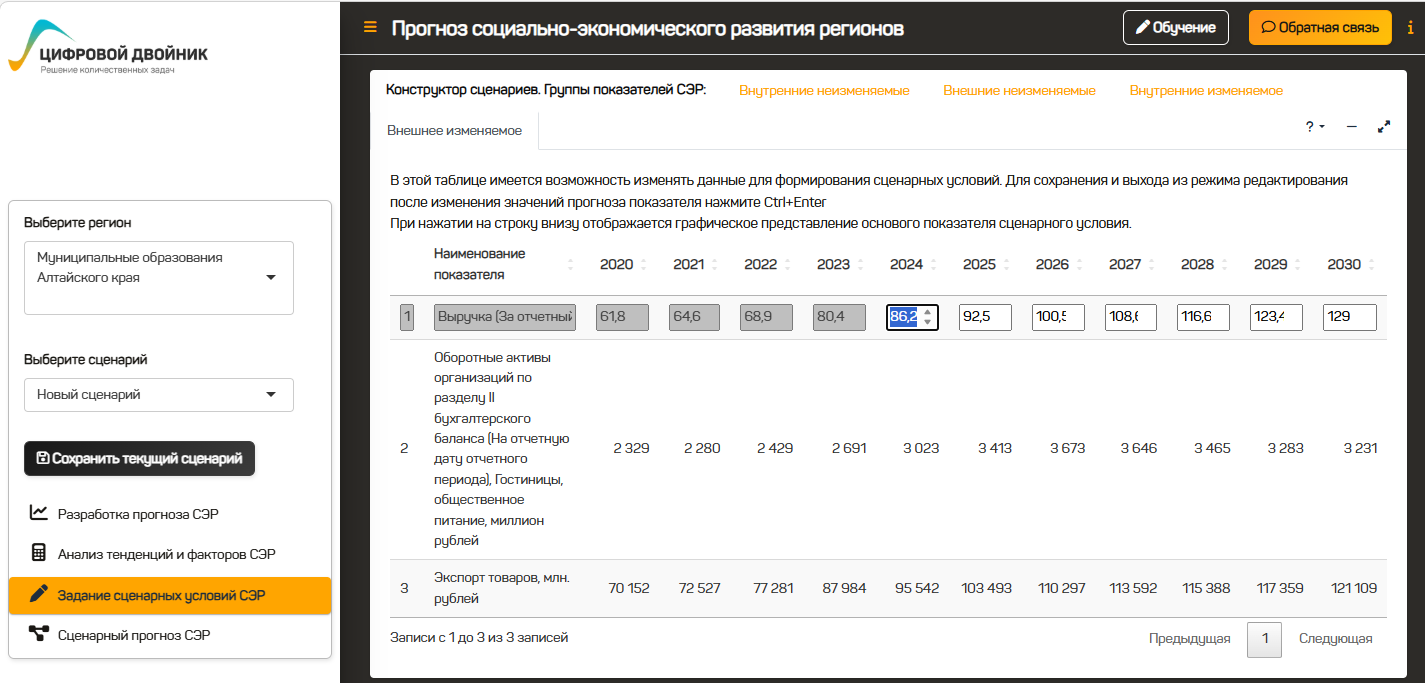
Figure 12 — Setting scenario conditions: assessing the impact of changes on the digital model
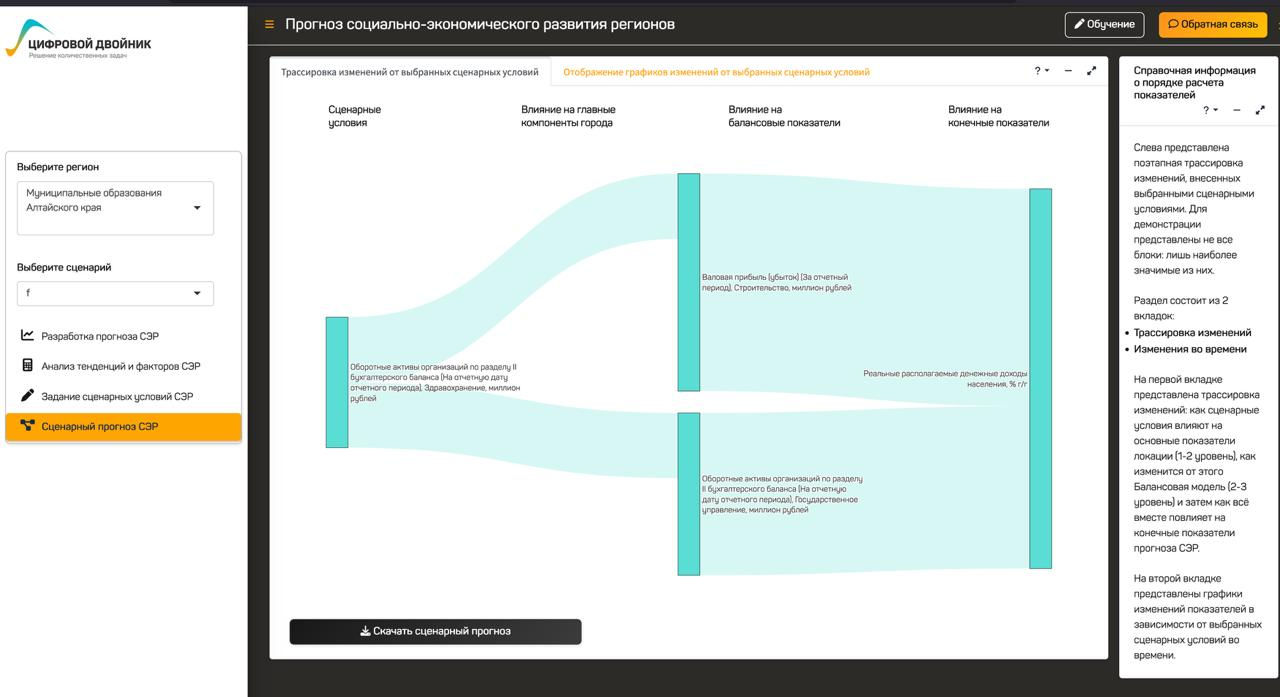
Figure 13 — Tracing consequences: following the impact of management decisions through the balance model
3.1.4 Optimize processes and speed up decisions
Goal: Find the best ways to reach the enterprise’s goals and shorten decision time.
What this delivers:
- optimal production programs;
- minimal costs for a given output volume;
- maximum profit under resource constraints;
- balancing of multiple goals;
- less time from the moment a question arises to a well-grounded decision.
Faster processes:
| Process | Before | After | Speedup |
|---|---|---|---|
| Preparing a production program | 2–4 weeks | 1–2 days | 10–20× |
| Analyzing development scenarios | 1–2 months | 1–3 days | 15–30× |
| Evaluating an investment project | 2–3 weeks | 2–3 days | 5–7× |
| Calculating product cost | 1–2 weeks | 1 hour | 80–160× |
Result: The enterprise runs at peak efficiency and reacts quickly to market changes.
3.2 Greater transparency and better-grounded decisions
3.2.1 A centralized management platform
Goal: Ensure transparency and traceability across all planning and analytical calculations.
What this delivers:
- transparency and traceability of planning and analytical calculations;
- verification of source data;
- versioning of calculation results;
- multi-user, role-based access to diagrams and results;
- logging of user actions in the system;
- a single information base for all departments.
Result: Greater trust in the company’s data, better management decisions, and fewer conflicts between departments.
3.2.2 For different management levels
3.2.2.1 For top management
Goals:
- get a tool for strategic planning;
- track progress toward target metrics;
- assess the effectiveness of investment programs;
- analyze the enterprise’s development scenarios.
Expected result:
- well-grounded strategic decisions;
- transparency of the enterprise’s operations;
- risk control;
- higher business value.
3.2.2.2 For middle management
Goals:
- automate planning processes;
- optimize production programs;
- manage product cost;
- track plan execution.
Expected result:
- 10–20× less time spent on planning;
- higher-quality plans;
- 5–10% lower product cost;
- 15–20% higher equipment utilization.
3.2.2.3 For specialists and analysts
Goals:
- get tools for deep analysis;
- automate routine calculations;
- run multi-variant calculations;
- model complex processes.
Expected result:
- freedom from routine work (up to 70% of their time);
- focus on analysis rather than data collection;
- the ability to test hypotheses;
- higher-quality analytics.
3.3 More efficient use of resources
3.3.1 Target efficiency metrics
Lower costs:
- Total operating costs: −10–15%
- Inventory costs: −15–20%
- Downtime costs: −20–30%
- Planning labor: −60–70%
Higher efficiency:
- Equipment utilization: +15–20%
- Return on sales: +3–5%
- Inventory turnover: +20–30%
- Decision speed: 10–20×
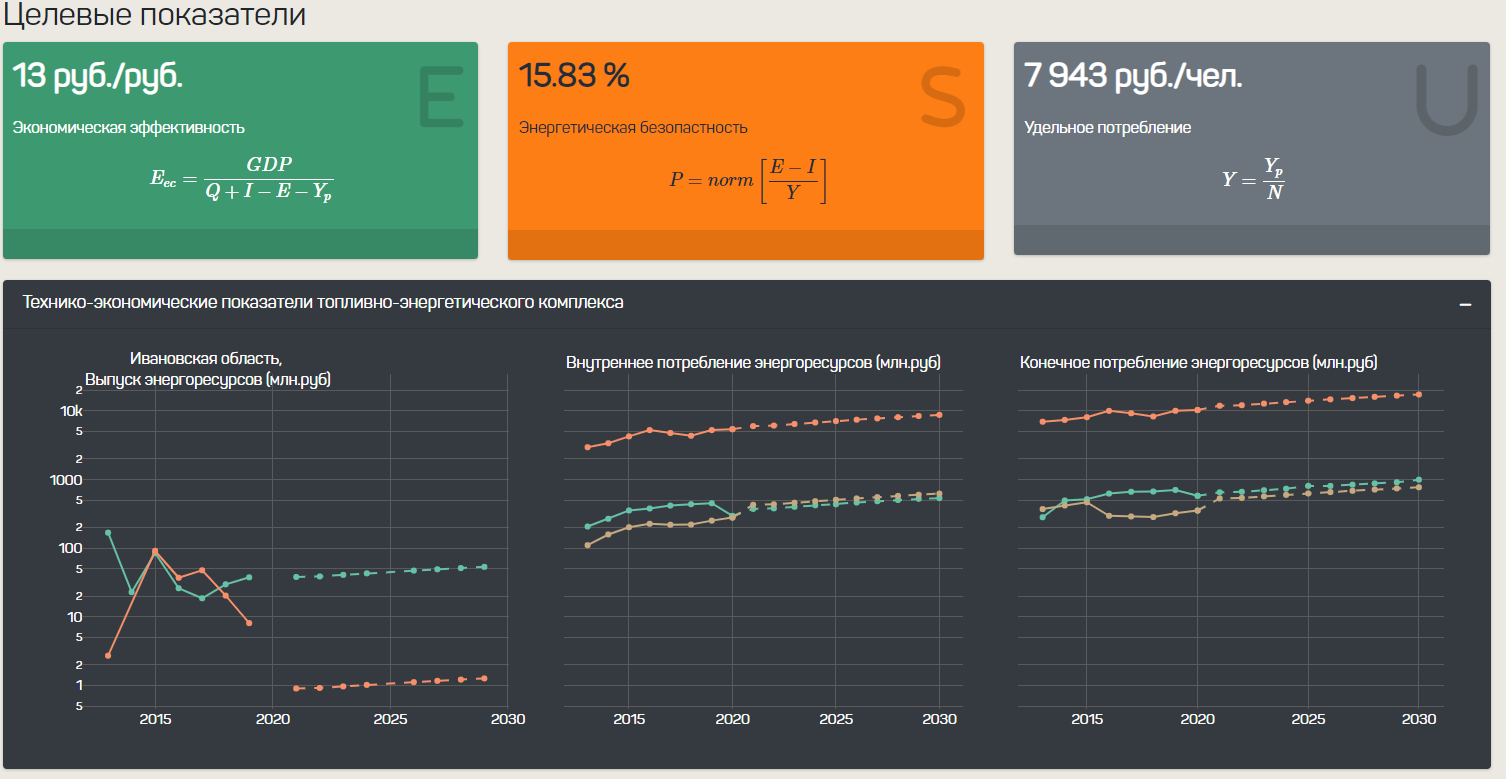
Figure 14 — Target metrics and calculation models: formulas, charts, and efficiency indicators
Payback:
- Typical payback period: 12–18 months
- 3-year ROI: 200–400%
3.4 Technological sovereignty and scalability
3.4.1 Import substitution
Goal: Build a fully Russian solution that doesn’t depend on foreign technology.
Implementation:
- Astra Linux SE (operating system);
- PostgreSQL (relational DBMS);
- ClickHouse (analytical DBMS);
- R (Posit) (statistical analysis);
- domestic libraries and components.
Result: Compliance with information security requirements and independence from sanctions.
3.4.2 Integration with existing systems
Goal: Ensure seamless work with the systems the enterprise already runs.
Implementation:
- a REST API for integration with ERP/MES;
- data import from a variety of sources;
- automatic synchronization;
- export of results to familiar formats.
Result: Minimal changes to existing processes and maximum return on investment.
3.4.3 Scalability
Goal: Run the system at enterprises of any size.
Implementation:
- horizontal scaling (adding servers);
- vertical scaling (increasing capacity);
- modular architecture (pay only for the modules you need);
- performance optimization.
Result: From small enterprises to large holdings on a single platform.
3.5 Long-term development goals
3.5.1 Build an ecosystem of digital twins
Vision: Integrate EDT with the other products in the line:
- CDT (City Digital Twin) — for territorial planning;
- PDT (Pipeline Digital Twin) — for infrastructure management;
- a single platform for end-to-end management.
Result: Synergy from integrating different management levels — from the enterprise to the territory.
3.5.2 Develop AI and machine learning
Plans:
- an AI assistant for hints and recommendations;
- automatic anomaly detection;
- predictive analytics;
- self-learning models.
Result: Even more accurate forecasts and recommendations.
3.5.3 Cloud version and SaaS model
Plans:
- cloud deployment;
- a subscription pricing model;
- access from anywhere in the world;
- automatic updates.
Result: A lower barrier to entry for small and medium enterprises.
All rights reserved Digital Twin LLC