Chapter 5 General architecture of the platform
5.1 System architecture
The Enterprise Digital Twin (EDT) software runs on open-source R (Posit) libraries and adds high-performance computing modules (microservices) written in Java and C++. The platform stores reference data and documents in PostgreSQL and ClickHouse, which handle large data volumes reliably and at scale. User interfaces use JavaScript and HTML, so the system stays interactive and accessible through web browsers.
A microservices architecture keeps the platform scalable and flexible: you can add or shut down components on the fly without disrupting the rest of the system. The EDT architecture integrates data, models, and interfaces end to end, creating a powerful tool for running an enterprise.
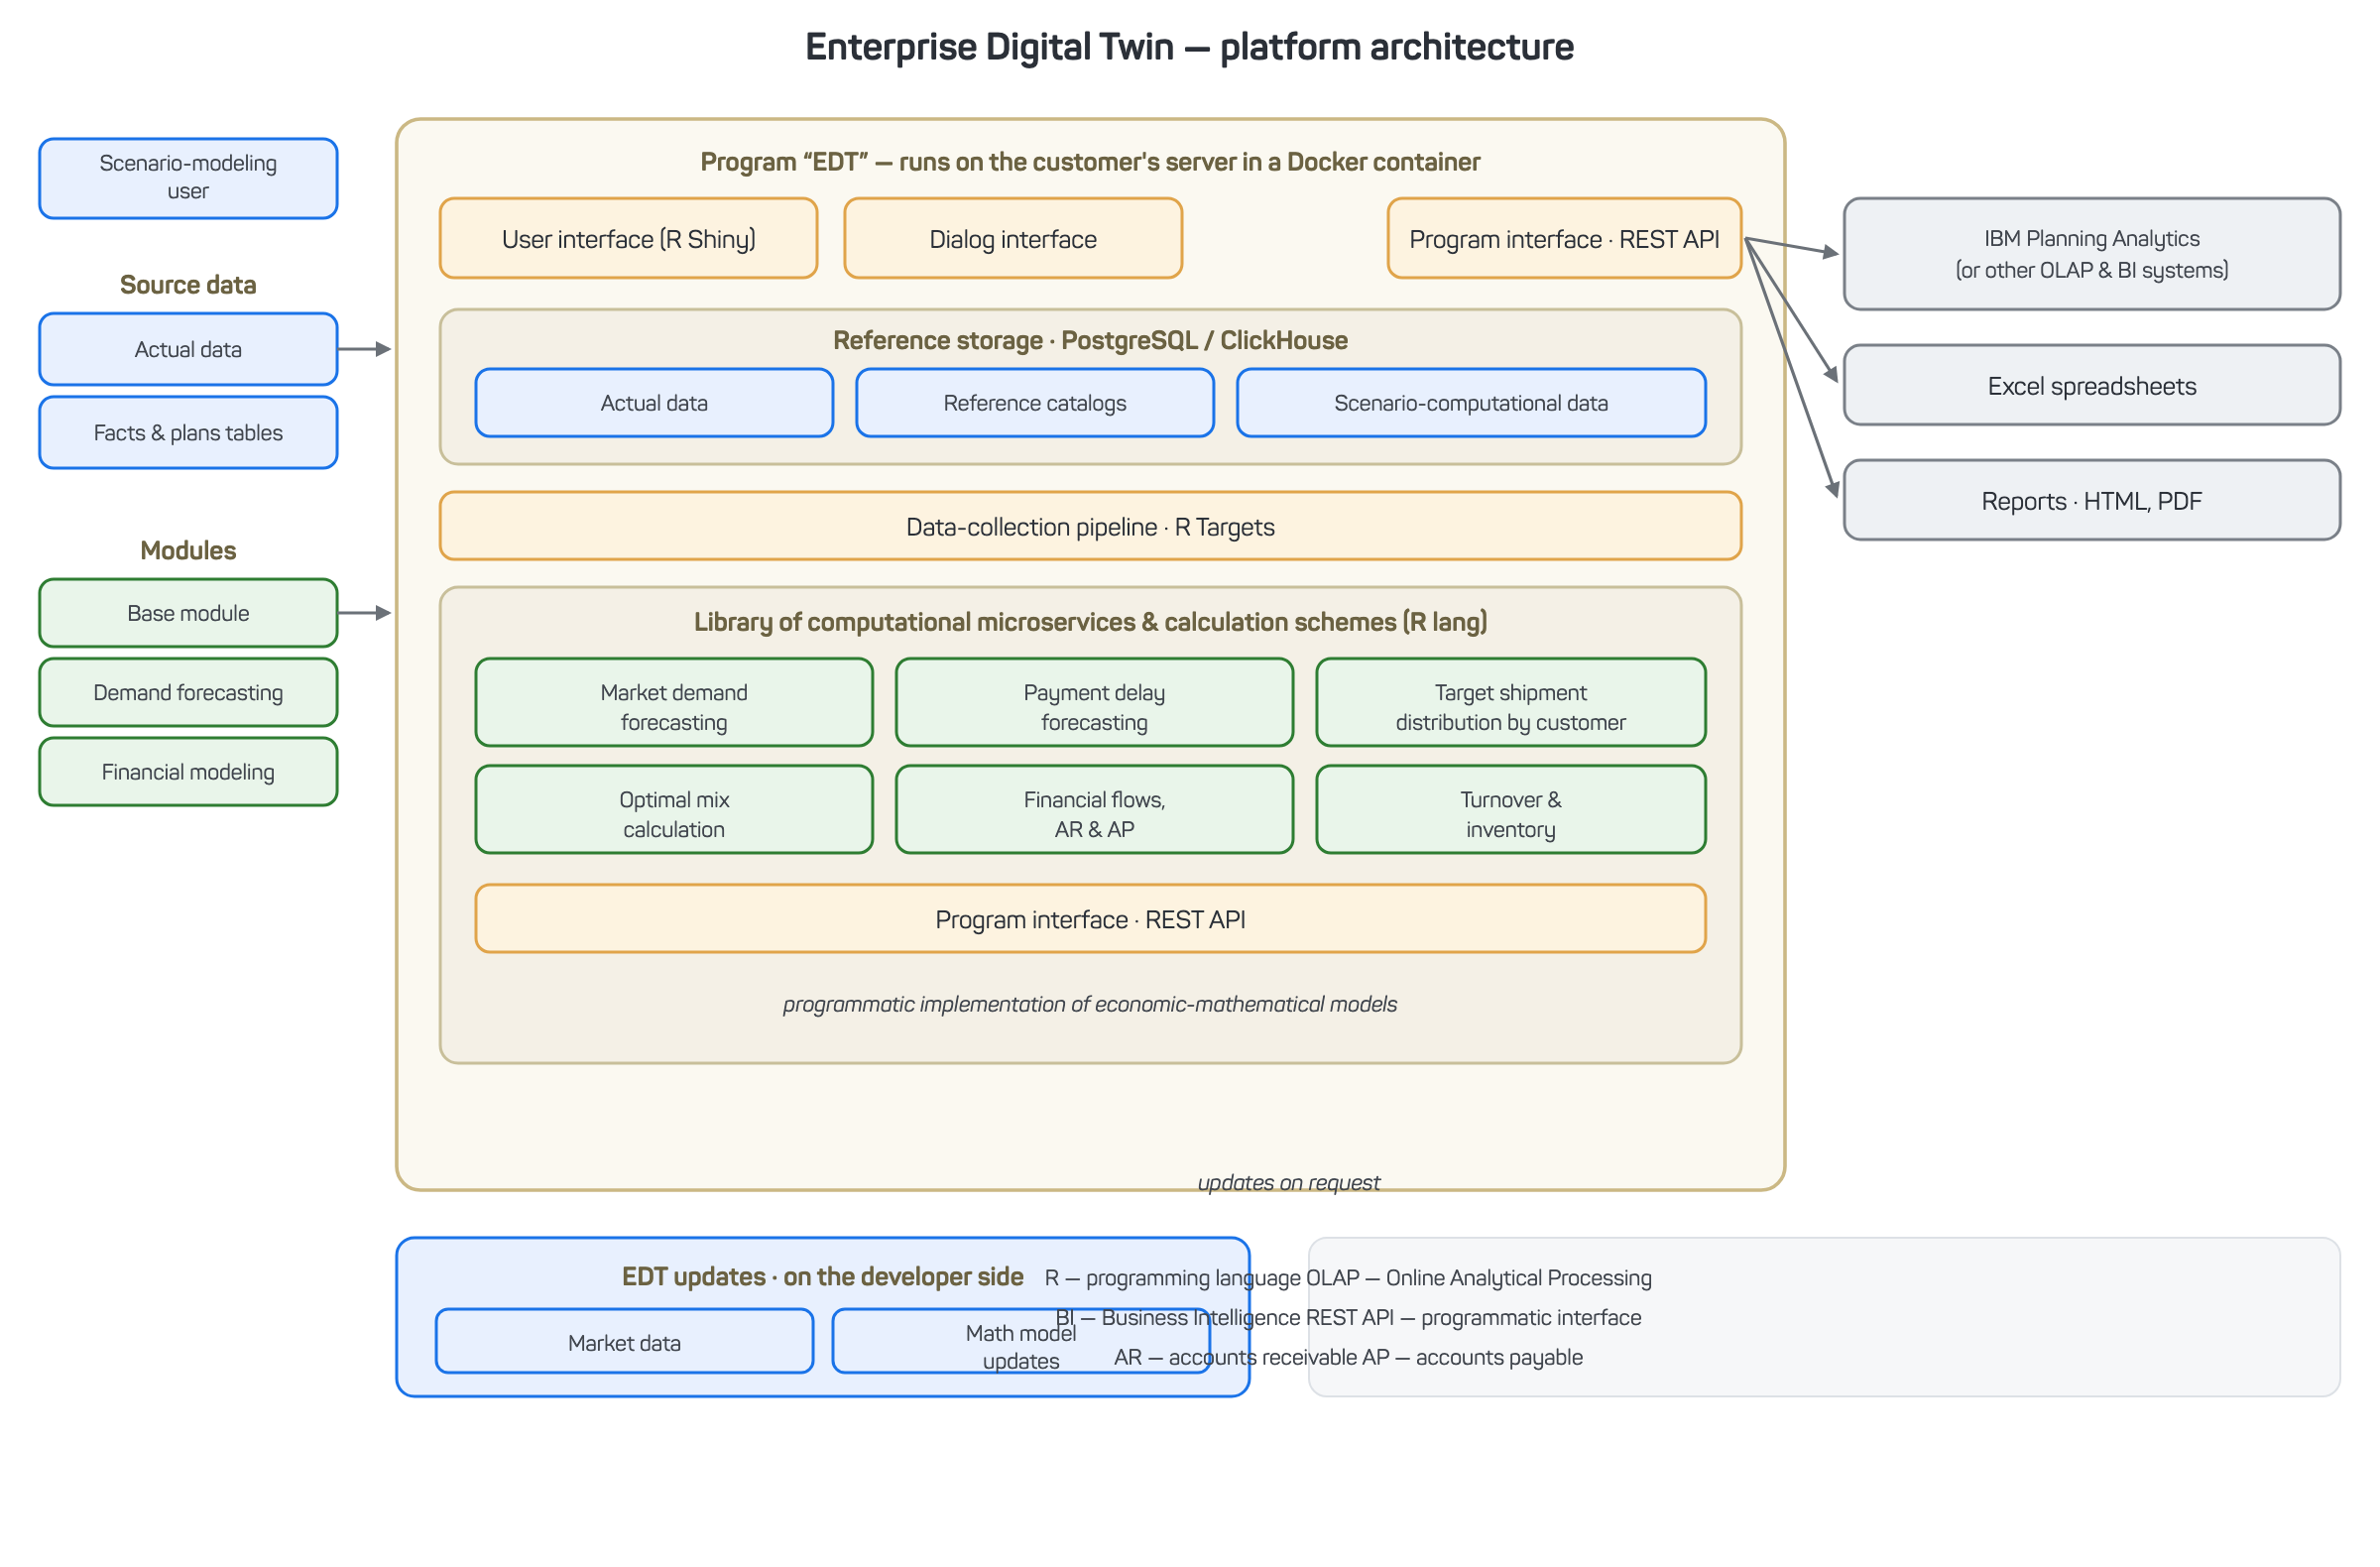
Figure 20 — EDT platform architecture
The architecture rests on a hierarchical system of indicators — from national goals and security doctrines down to municipal and spatial indicators — tied together by an ensemble of mathematical models: a demographic model, system dynamics, sensitivity matrices, and intersectoral and interterritorial balances.
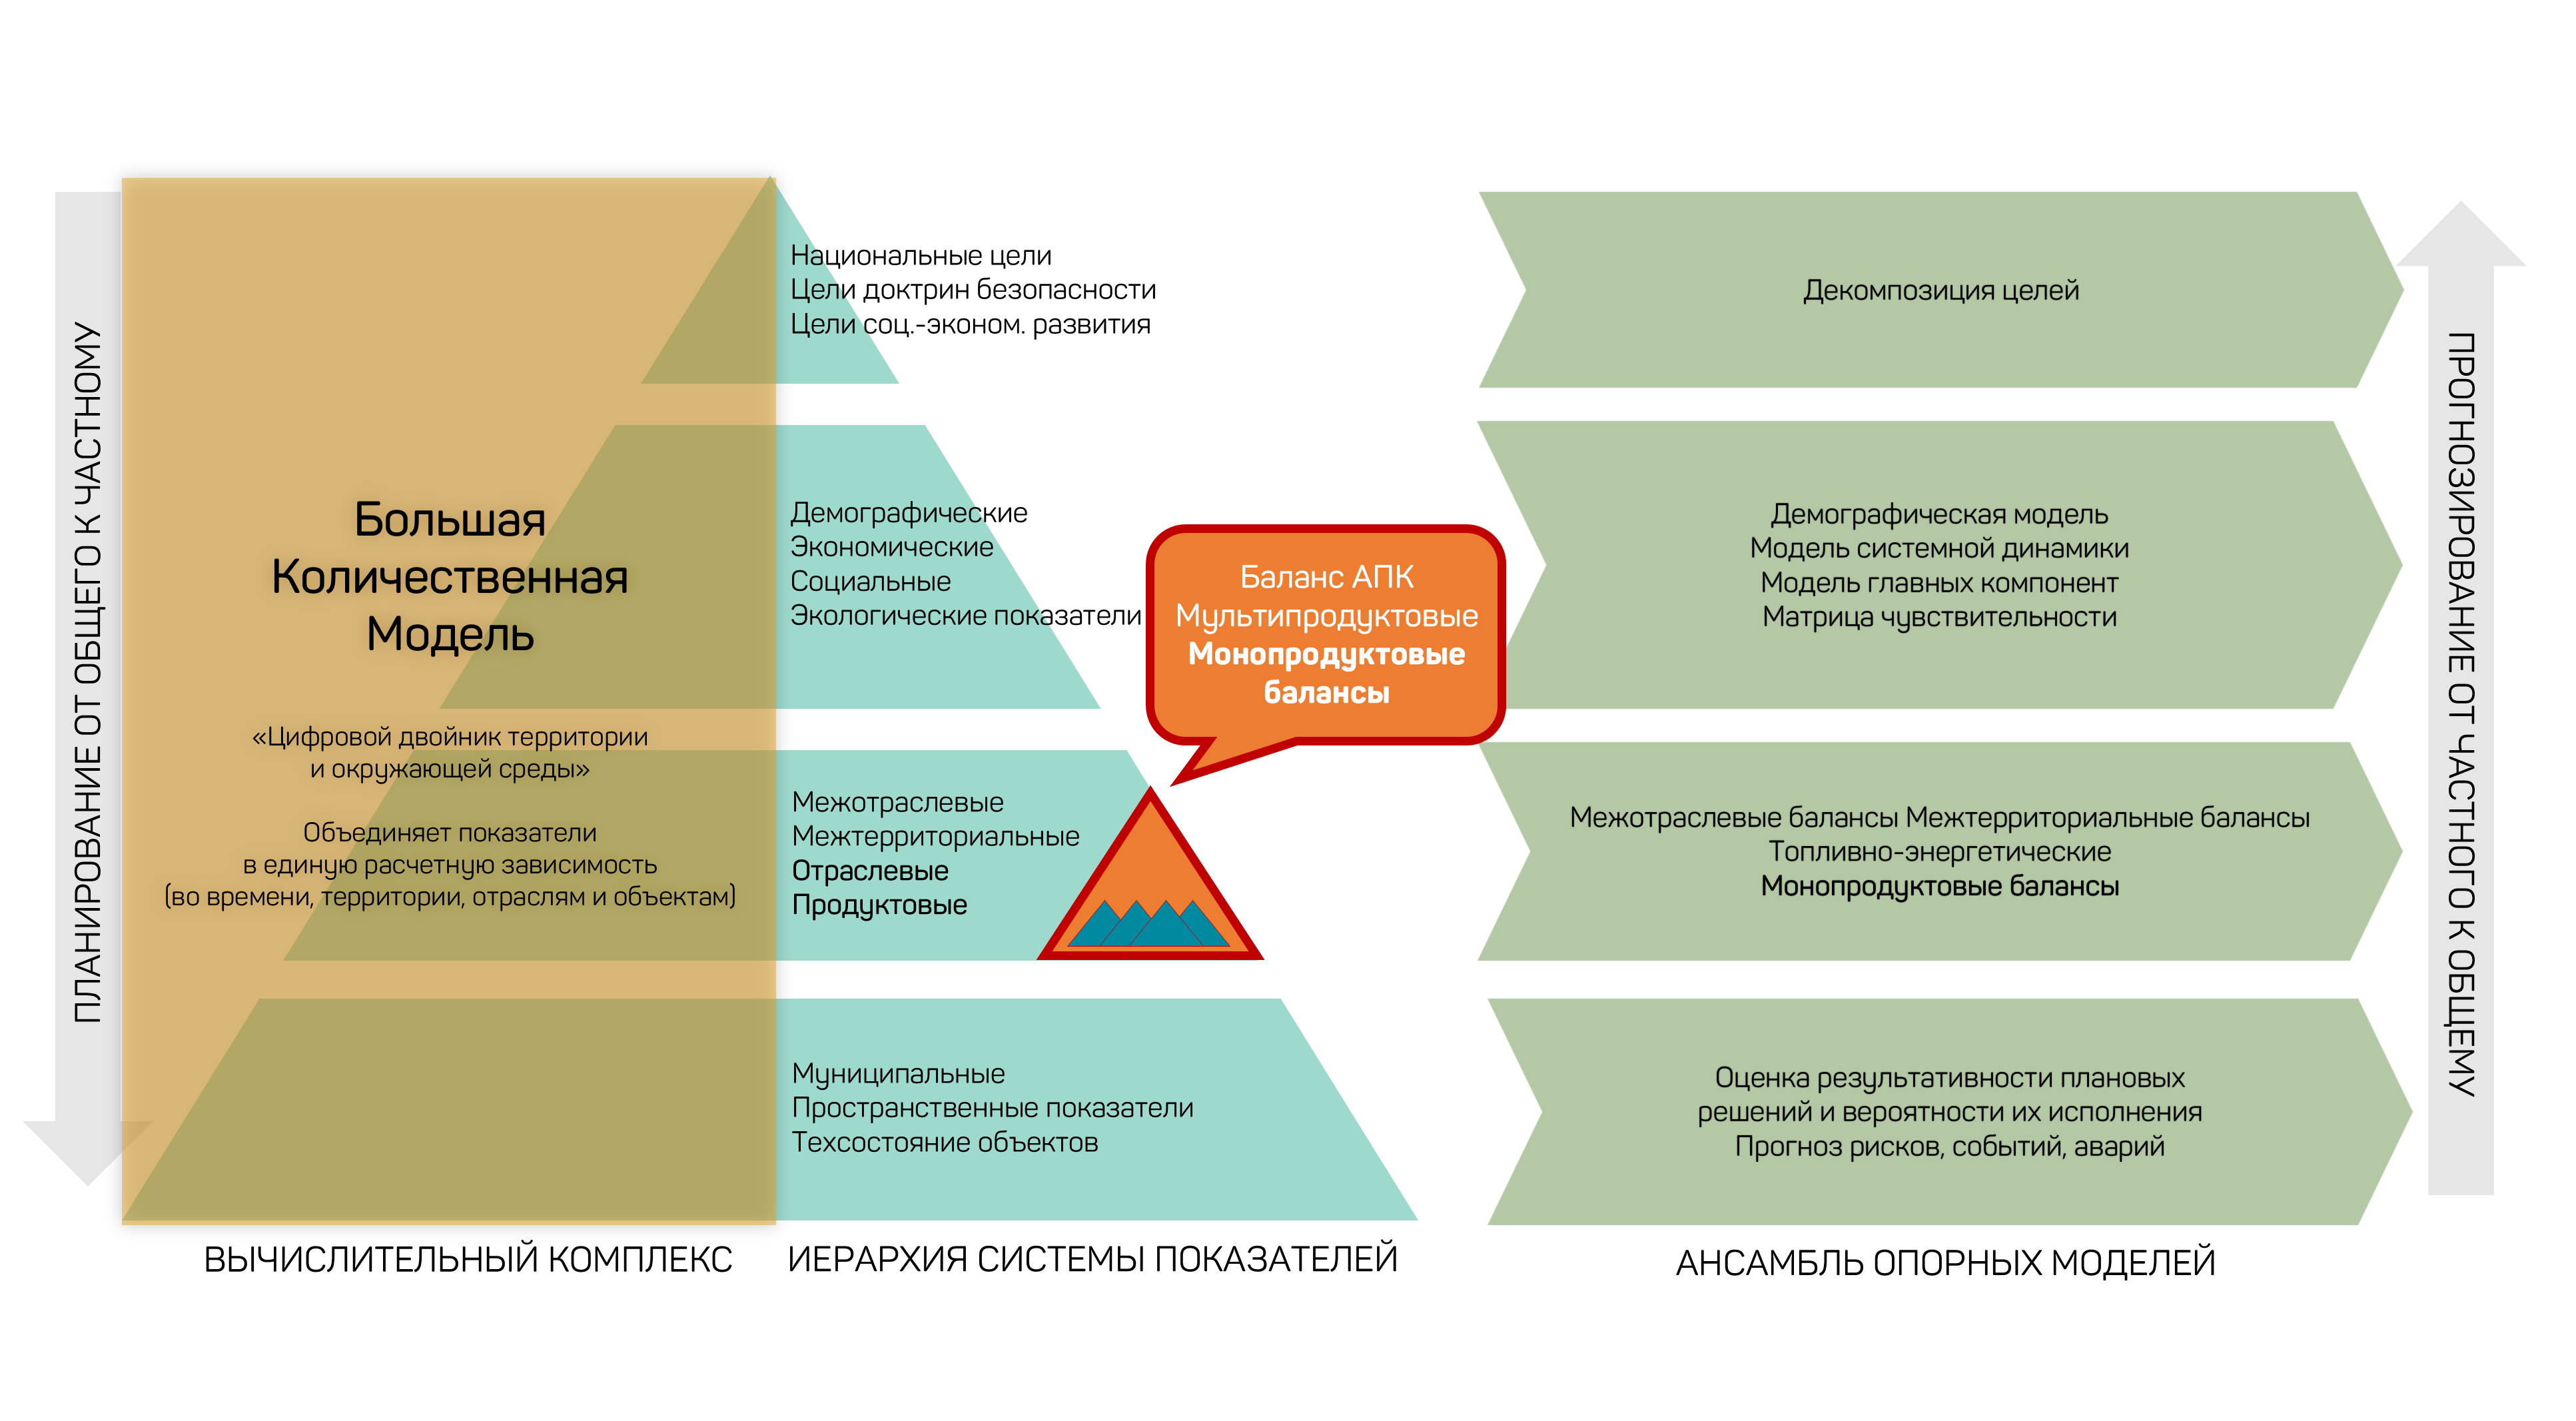
Figure 21 — Hierarchical system of indicators and the EDT model ensemble
5.2 Core architecture components
1. Data ingestion and processing stage (ETL)
ETL (Extract, Transform, Load) technology collects data from various sources, transforms it, and loads it into a central store. Data can come from the enterprise’s internal systems as well as from external sources (for example, Rosstat, the Federal Tax Service, or APIs).
Key capabilities:
- API integration lets the system pull data in real time from various sources, keeping calculations and analysis current;
- the system normalizes data automatically, bringing it to a single standard and removing duplicates, gaps, and format errors;
- ClickHouse/PostgreSQL stores large volumes of analytical data, reference tables, and time series, so the system can process data in real time with high performance.
In the agriculture (AIC) implementation, the model architecture includes two linked loops: a consumption model (City Digital Twin) built on correlation and stochastic relationships, and a production model (Enterprise Digital Twin) built on functional and stochastic relationships. Each loop works with facts and forecasts, including baseline and scenario projections.
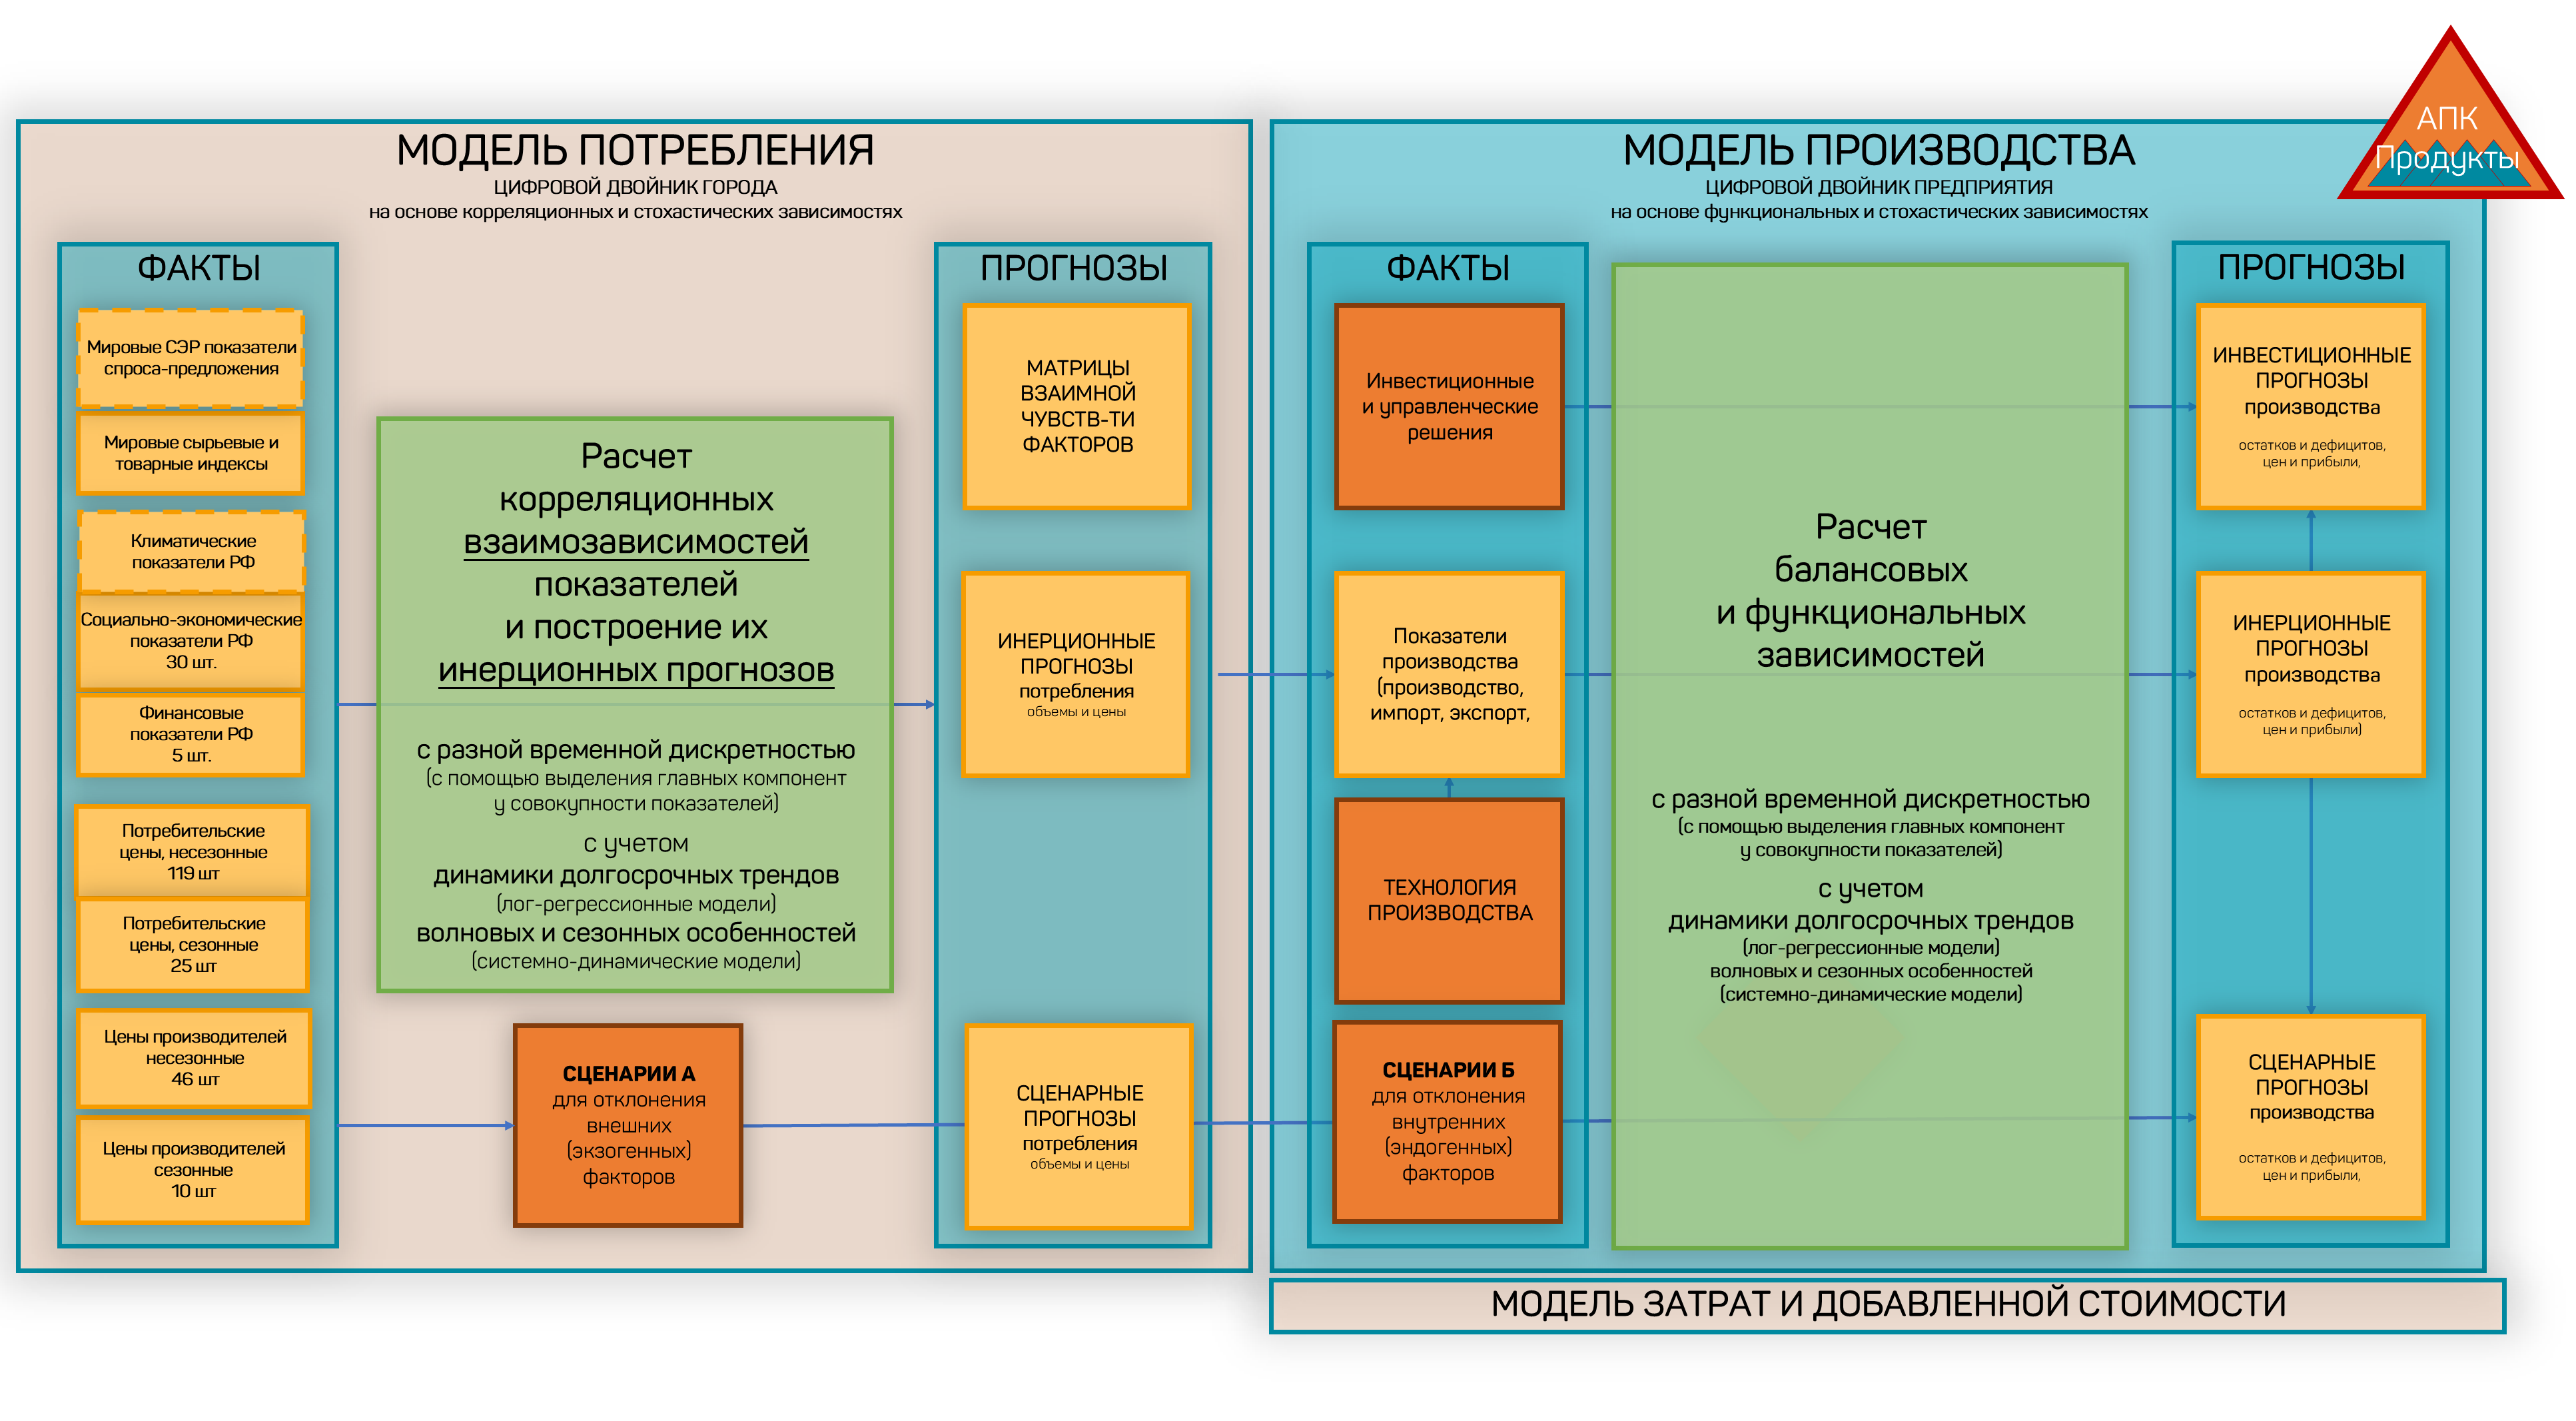
Figure 22 — Architecture of the AIC model and single-product balances: consumption model and production model
2. Computation and analytics stage
High-performance computing runs on Java and C++ modules, which process large data volumes with minimal latency.
Technologies and tools:
- R (Posit) supports the complex statistical and mathematical models needed for scenario modeling, factor analysis, and forecasting;
- Targets (tar_target) organizes computation nodes and manages their dependencies. It tracks whether data and calculations are current, supports versioning of computational models, and enables repeated parallel computations;
- the system supports intersectoral and interterritorial balance models as well as a resource-balance model, which estimate the enterprise’s resource needs and optimize how those resources are allocated.
3. User interfaces
User interfaces use JavaScript and HTML, giving access to the system through web browsers and an intuitive way to work with data and analytical tools.
Interface capabilities:
- the interfaces support interactive dashboards, reports, and data-driven visualizations, so users can easily reach analytics and make management decisions based on current data;
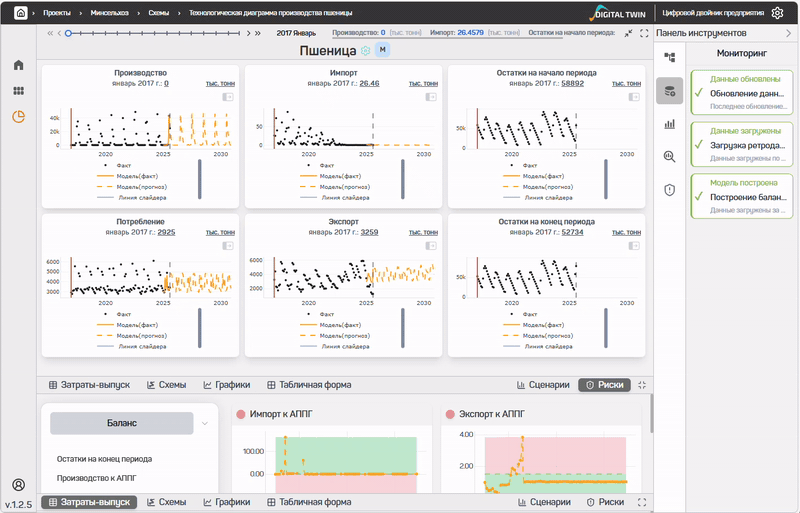
Figure 23 — EDT user interface: interactive agriculture (MSX) dashboard
- the REST API lets external systems integrate with the EDT and gives access to the system’s data and functions through programmatic interfaces.
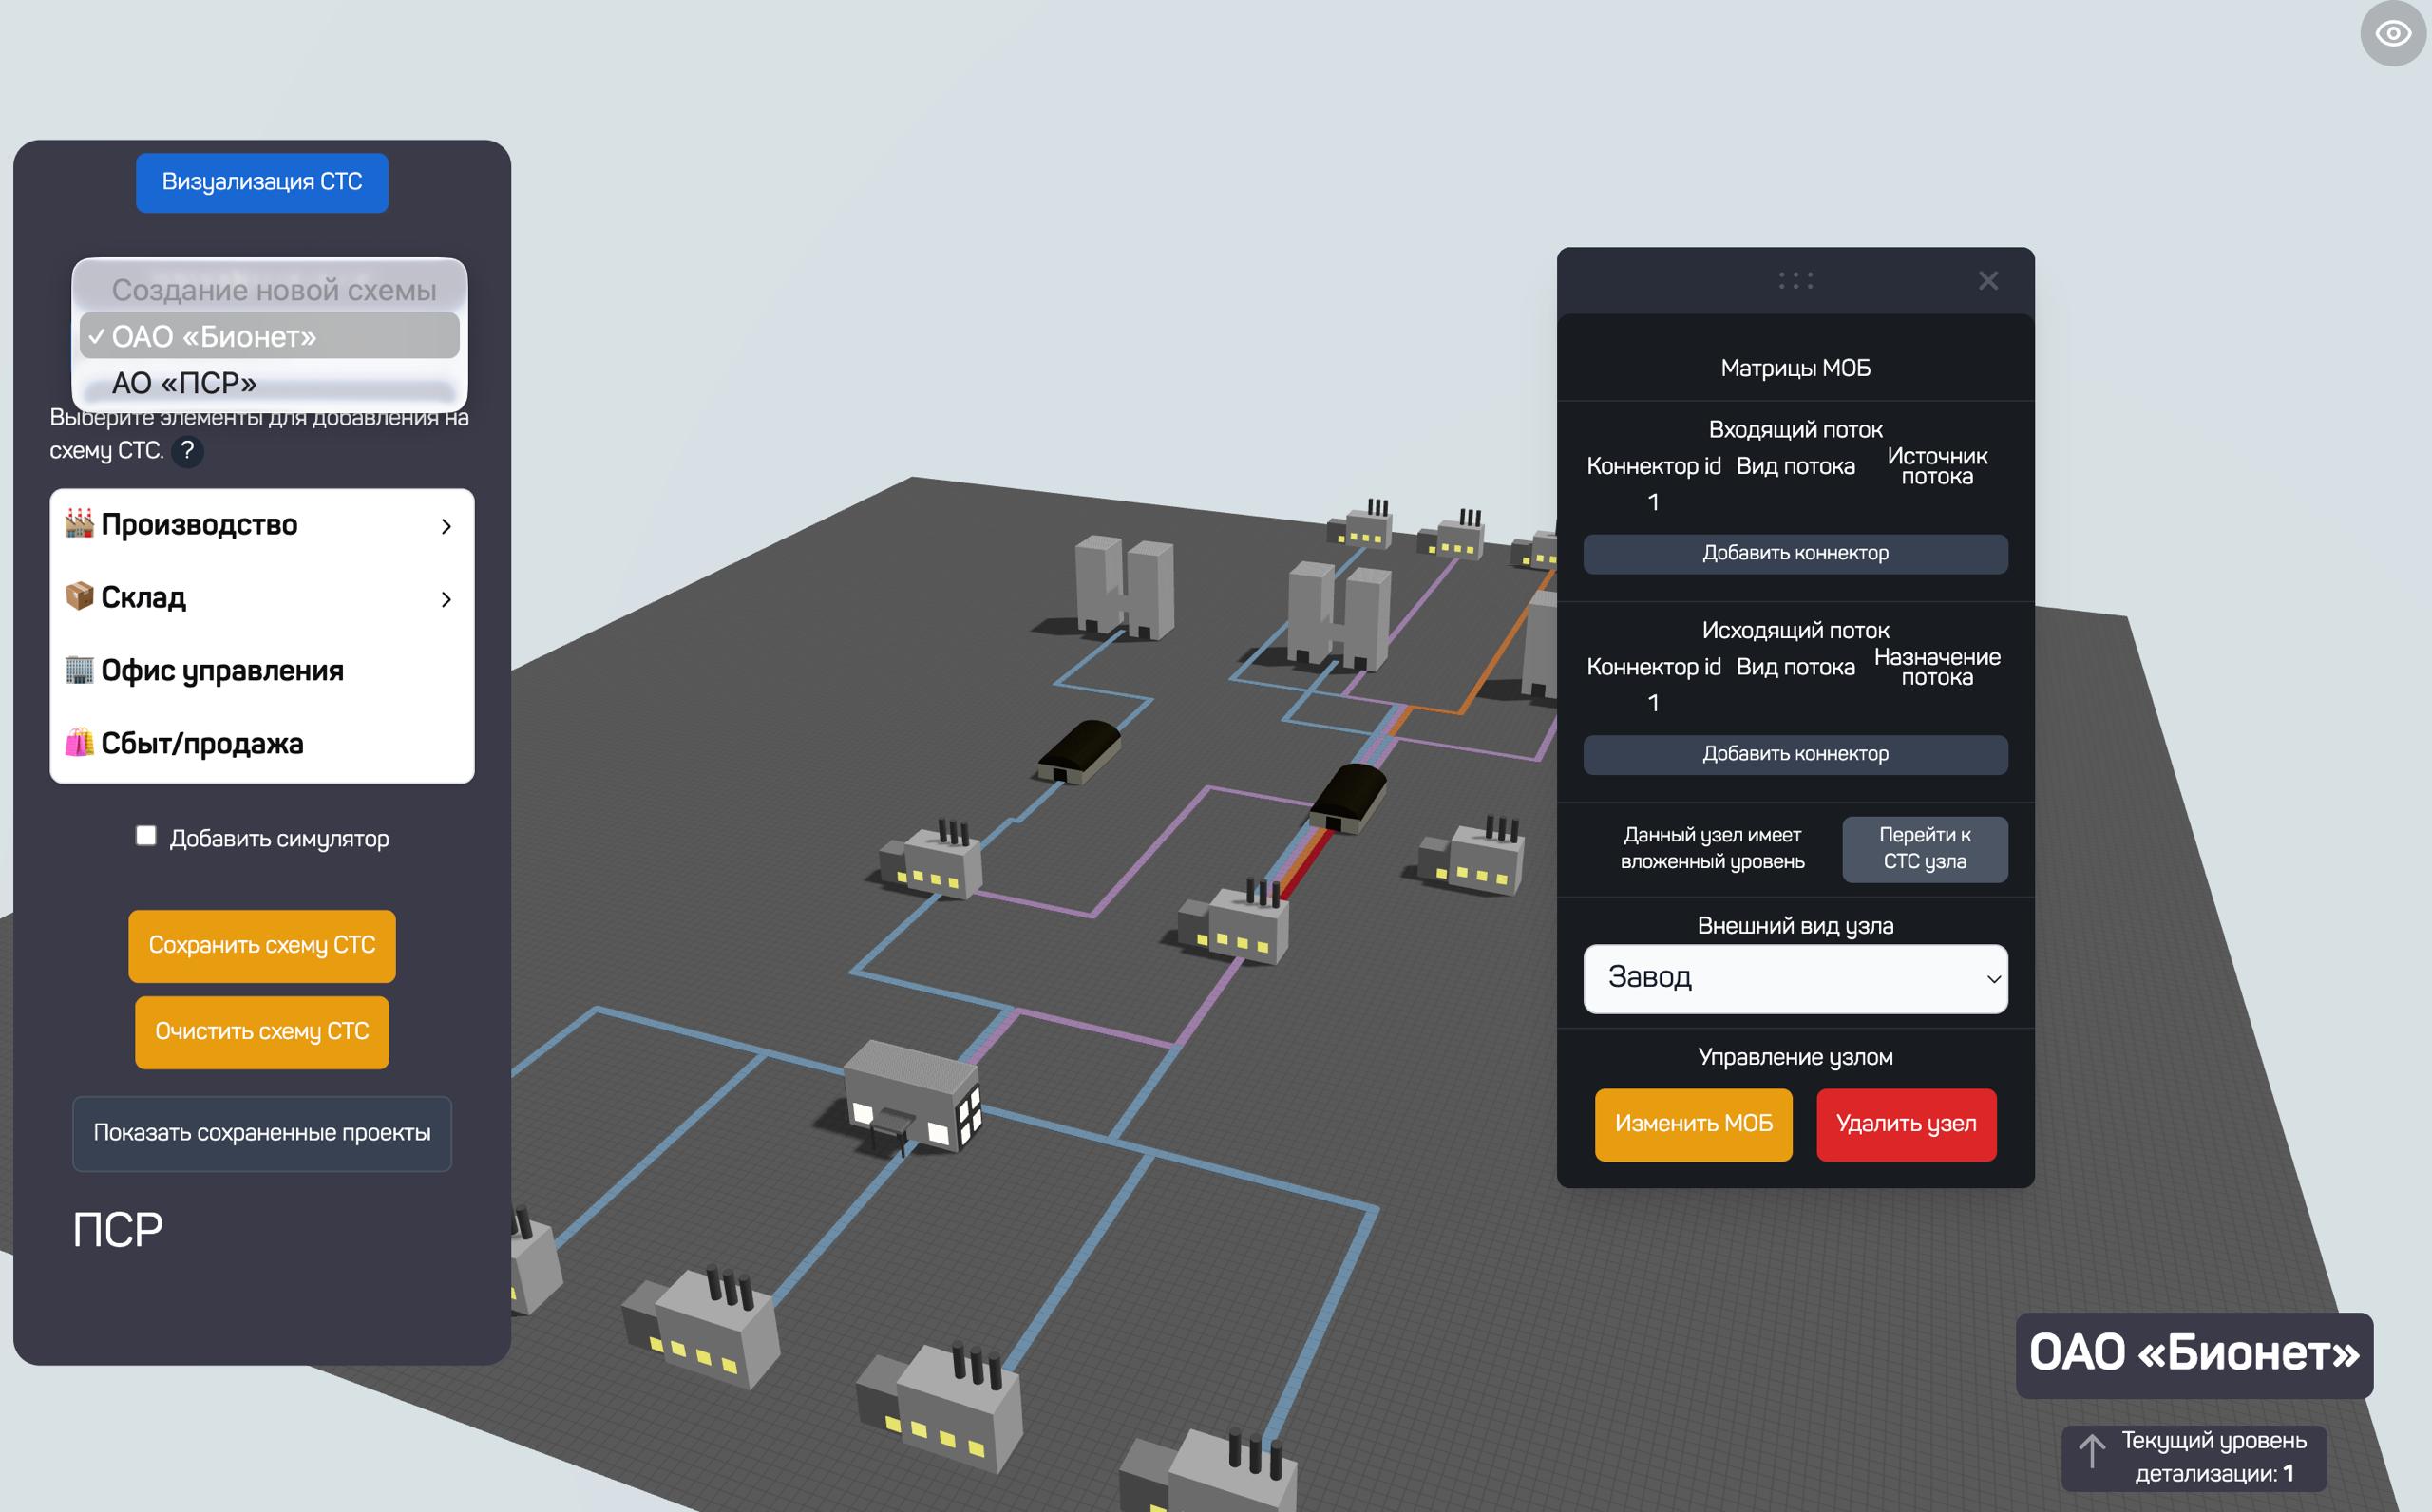
Figure 24 — 3D visualization of the enterprise’s structural and technological scheme in the EDT interface
5.3 Key technologies
| Technology | Description | Use in the EDT |
|---|---|---|
| R (Posit) | Open-source platform for statistical and analytical computing | Used to build complex mathematical models and run statistical analysis |
| Java and C++ | High-performance programming languages for computation | Run computationally heavy operations quickly |
| PostgreSQL | Relational database management system (DBMS) for storing structured data | Used to store reference data, reference tables, and documents |
| ClickHouse | Columnar database management system (DBMS) for high-performance analytics on large structured datasets | Stores and processes large volumes of analytical information |
| ETL | Technology for extracting, transforming, and loading data | Used to integrate and normalize data from different sources |
| Targets (tar_target) | Library for declaring and running analytical computation nodes linked into a single pipeline (network), with change tracking | Manages computations, versioning, and data-currency control |
| JavaScript, HTML | Technologies for building user interfaces | Used to create intuitive interfaces and interactive dashboards |
5.4 Architecture highlights
5.4.1 Scalability and performance
The EDT architecture delivers high performance by using ClickHouse to store large data volumes and Java/C++ for the computing modules.
5.5 Architecture of indicator linkage
The EDT links territory indicators (City Digital Twin) and enterprise indicators (Enterprise Digital Twin) into a single space. Socio-economic development and market indicators (240 indicators), product prices (667 items), and product shares in consumption form factor sensitivity matrices and baseline forecasts, which then roll up into single-product balances — both actual and scenario.
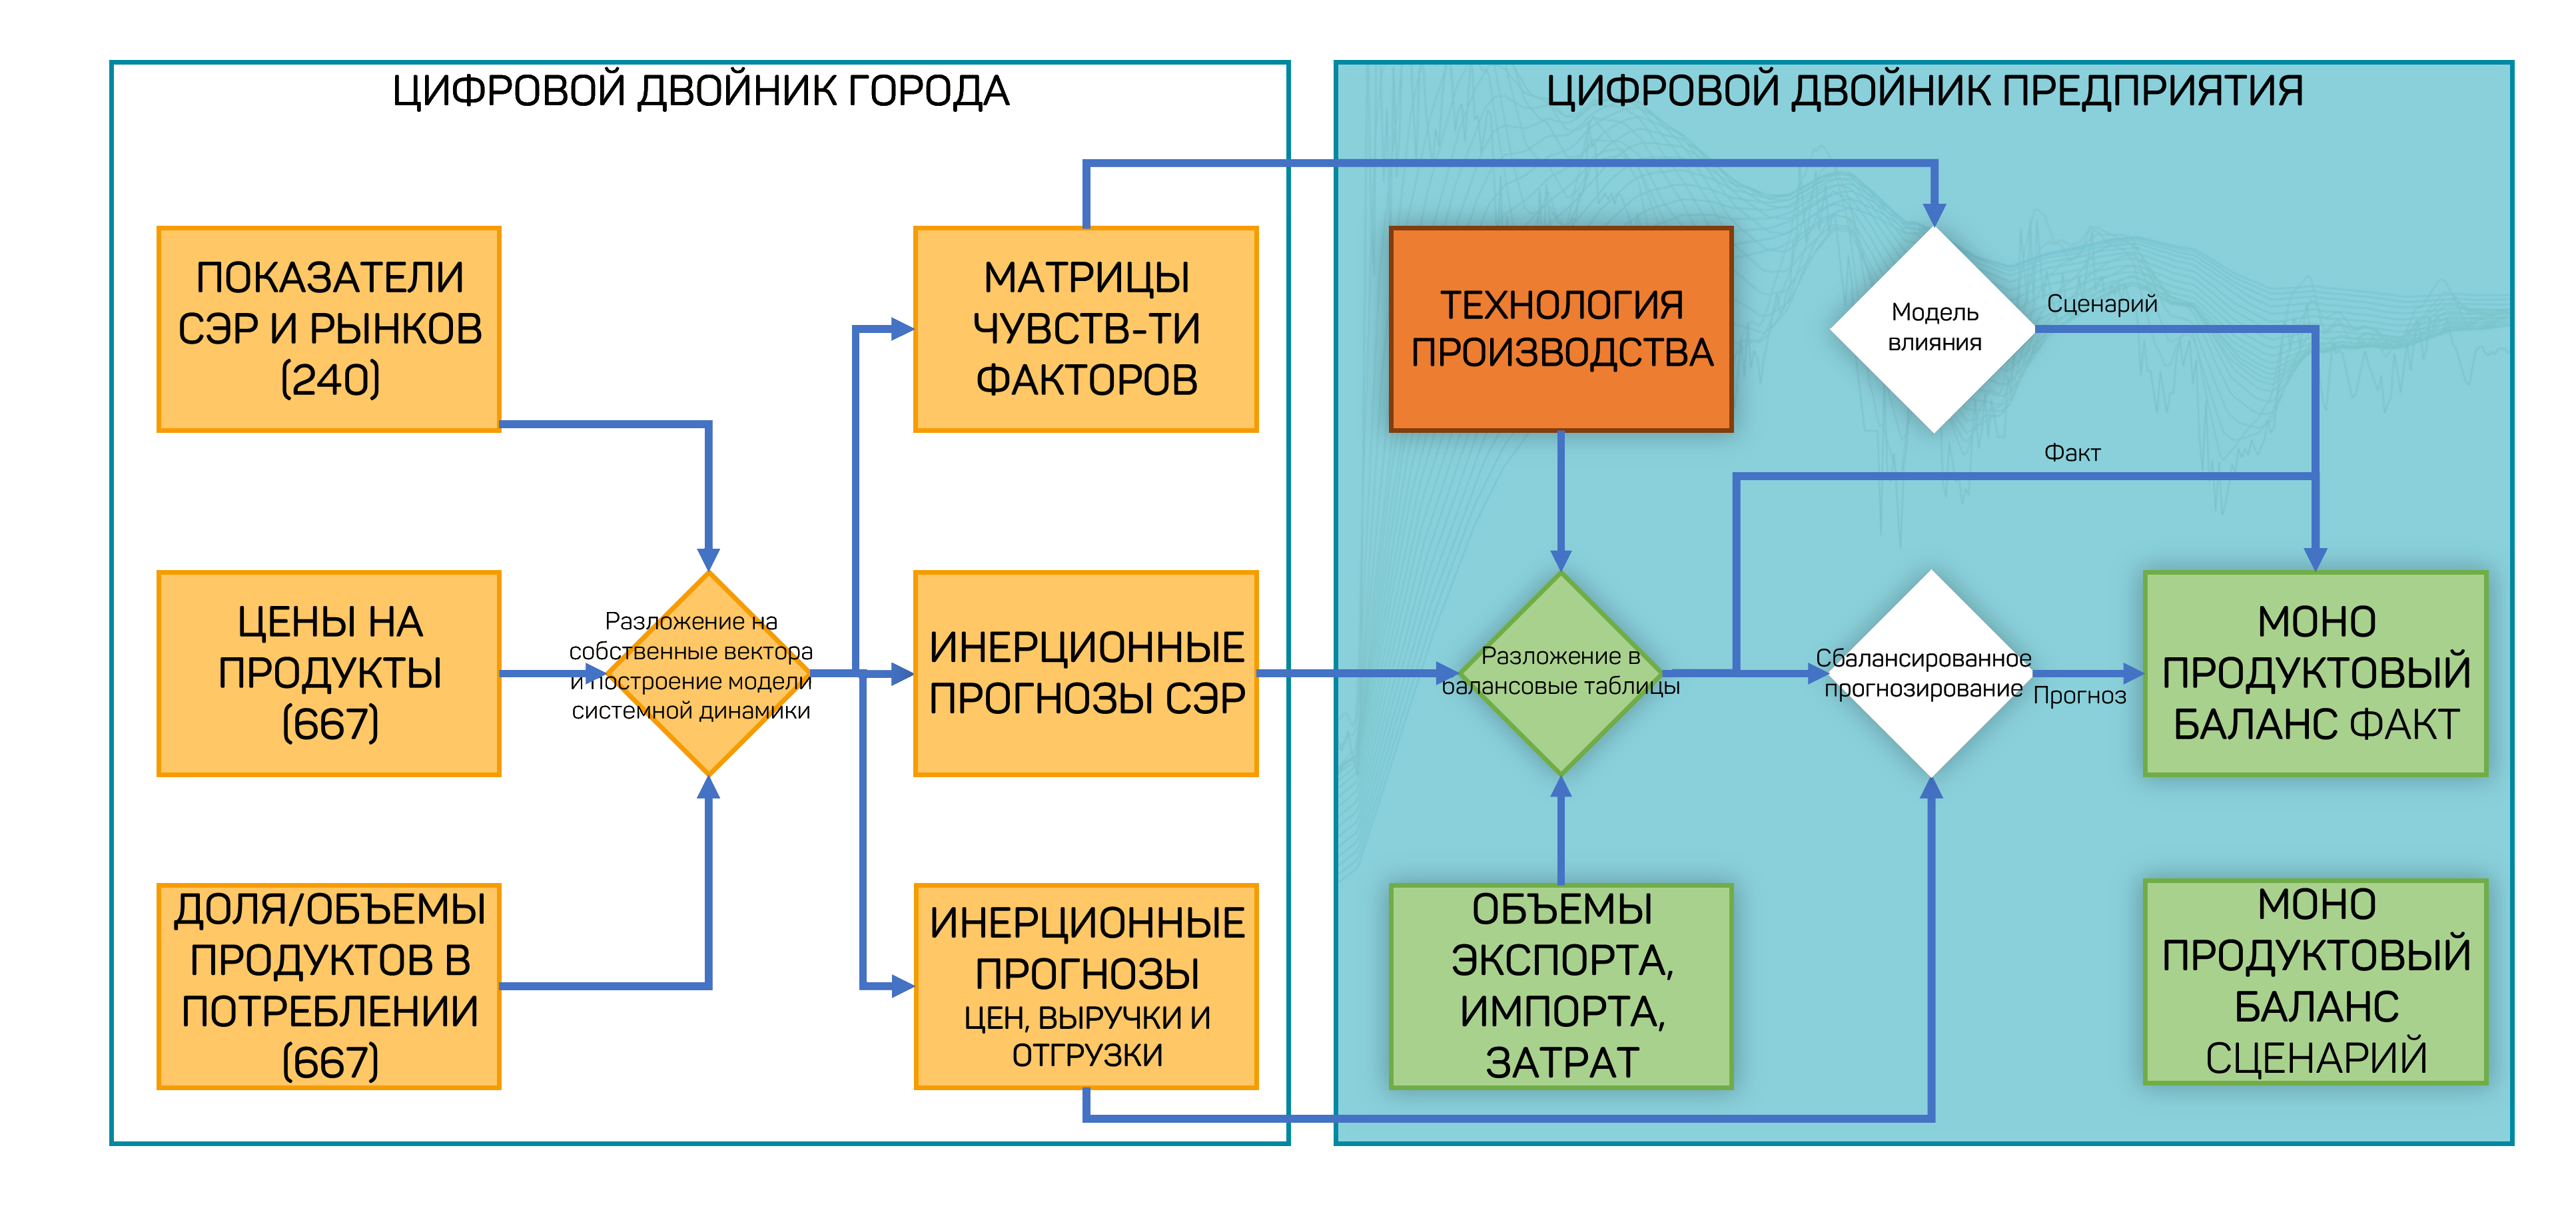
Figure 26 — Architecture of indicator linkage: City Digital Twin and Enterprise Digital Twin
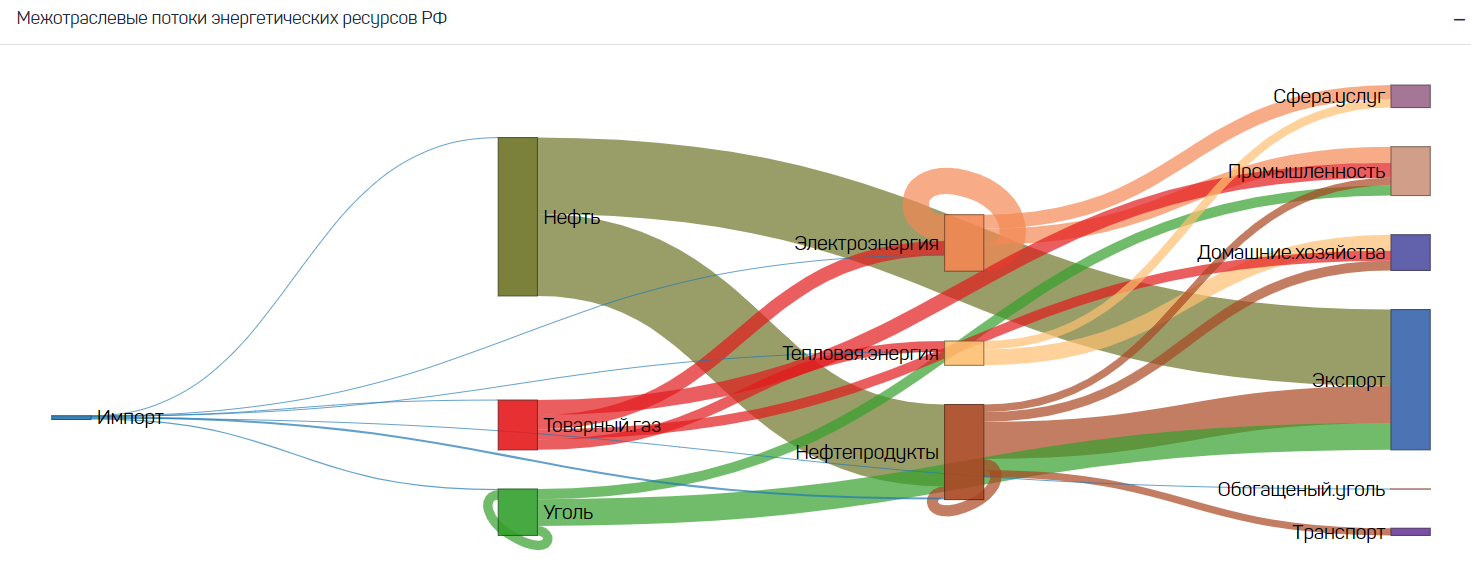
Figure 27 — Intersectoral flows of energy resources: Sankey diagram of relationships